. 2008 Jan 1;36(4):462-494.
doi: 10.1177/0049124108314720.

An Empirical Evaluation of the Use of Fixed Cutoff Points in RMSEA Test Statistic in Structural Equation Models

Affiliations

An Empirical Evaluation of the Use of Fixed Cutoff Points in RMSEA Test Statistic in Structural Equation Models

Feinian Chen et al. Sociol Methods Res. .

Abstract

This article is an empirical evaluation of the choice of fixed cutoff points in assessing the root mean square error of approximation (RMSEA) test statistic as a measure of goodness-of-fit in Structural Equation Models. Using simulation data, the authors first examine whether there is any empirical evidence for the use of a universal cutoff, and then compare the practice of using the point estimate of the RMSEA alone versus that of using it jointly with its related confidence interval. The results of the study demonstrate that there is little empirical support for the use of .05 or any other value as universal cutoff values to determine adequate model fit, regardless of whether the point estimate is used alone or jointly with the confidence interval. The authors' analyses suggest that to achieve a certain level of power or Type I error rate, the choice of cutoff values depends on model specifications, degrees of freedom, and sample size.


Figures
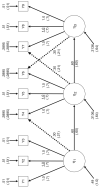
Figure 1
Figure 1
Target Population Model 1 Note: Numbers shown are unstandardized parameter values with standardized values in parentheses; solid and dashed lines represent the population model structure, and dashed lines represent omitted parameters under model misspecification.
Figure 2
Figure 2
Target Population Model 2 Note: Numbers shown are unstandardized parameter values with standardized values in parentheses; solid and dashed lines represent the population model structure, and dashed lines represent omitted parameters under model misspecification.
Figure 3
Figure 3
Target Population Model 3 Note: Numbers shown are unstandardized parameter values with standardized values in parentheses; solid and dashed lines represent the population model structure, and dashed lines represent omitted parameters under model misspecification.
Figure 4
Figure 4
Model Rejection Rates by Sample Size, H0: RMSEA ≤ c Model 1, Correct Specification Note: RMSEA = root mean error of approximation.
Figure 5
Figure 5
Model Rejection Rates by Sample Size, H0: RMSEA ≤ c Model 1, Smallest Misspecification Note: RMSEA = root mean error of approximation.
Figure 6
Figure 6
Model Rejection Rates by Sample Size, H0: RMSEA ≤ c Model 1, Moderate Misspecification Note: RMSEA = root mean error of approximation.
Figure 7
Figure 7
Model Rejection Rates by Sample Size, H0: RMSEA ≤ c Model 1, Severest Misspecification Note: RMSEA = root mean error of approximation.
Figure 8
Figure 8
Model Rejection Rates by Sample Size, H0: RMSEA ≤ c Model 2, Correct Specification Note: RMSEA = root mean error of approximation.
Figure 9
Figure 9
Model Rejection Rates by Sample Size, H0: RMSEA ≤ c Model 2, Smallest Misspecification Note: RMSEA = root mean error of approximation.
Figure 10
Figure 10
Model Rejection Rates by Sample Size, H0: RMSEA ≤ c Model 2, Moderate Misspecification Note: RMSEA = root mean error of approximation.
Figure 11
Figure 11
Model Rejection Rates by Sample Size, H0: RMSEA ≤ c Model 2, Severest Misspecification Note: RMSEA = root mean error of approximation.
Figure 12
Figure 12
Model Rejection Rates by Sample Size, H0: RMSEA ≤ c Model 3, Correct Specification Note: RMSEA = root mean error of approximation.
Figure 13
Figure 13
Model Rejection Rates by Sample Size, H0: RMSEA ≤ c Model 3, Smallest Misspecification Note: RMSEA = root mean error of approximation.
Figure 14
Figure 14
Model Rejection Rates by Sample Size, H0: RMSEA ≤ c Model 3, Moderate Misspecification Note: RMSEA = root mean error of approximation.
Figure 15
Figure 15
Model Rejection Rates by Sample Size, H0: RMSEA ≤ c Model 3, Severest Misspecification Note: RMSEA = root mean error of approximation.

References

    1. Barrett P. Structural Equation Modeling: Adjusting Model Fit. Personality and Individual Differences. 2007;42:815–24.
    1. Bentler PM. Comparative Fit Indexes in Structural Models. Psychological Bulletin. 1990;107:238–246. - PubMed
    1. Bentler PM. EQS: Structural equations program manual, Version 5.0. BMDP Statistical Software; Los Angeles: 1995.
    1. Bentler P. On Tests and Indices for Evaluating Structural Models. Personality and Individual Differences. 2007;42:825–29.
    1. Bollen KA, Long JS. Introduction. In: Bollen K, Long J, editors. Testing Structural Equation Models. Sage; Newbury Park, CA: 1993. pp. 1–9.

LinkOut - more resources