. 2009 Dec;66(23):3797-808.
doi: 10.1007/s00018-009-0153-9.

GABA transporter lysine 448: a key residue for tricyclic antidepressants interaction

Affiliations

GABA transporter lysine 448: a key residue for tricyclic antidepressants interaction

Francesca Cherubino et al. Cell Mol Life Sci. 2009 Dec.

Abstract

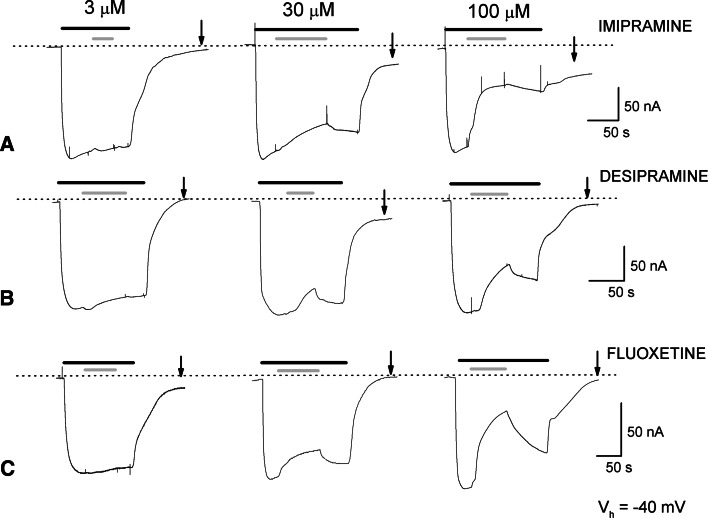
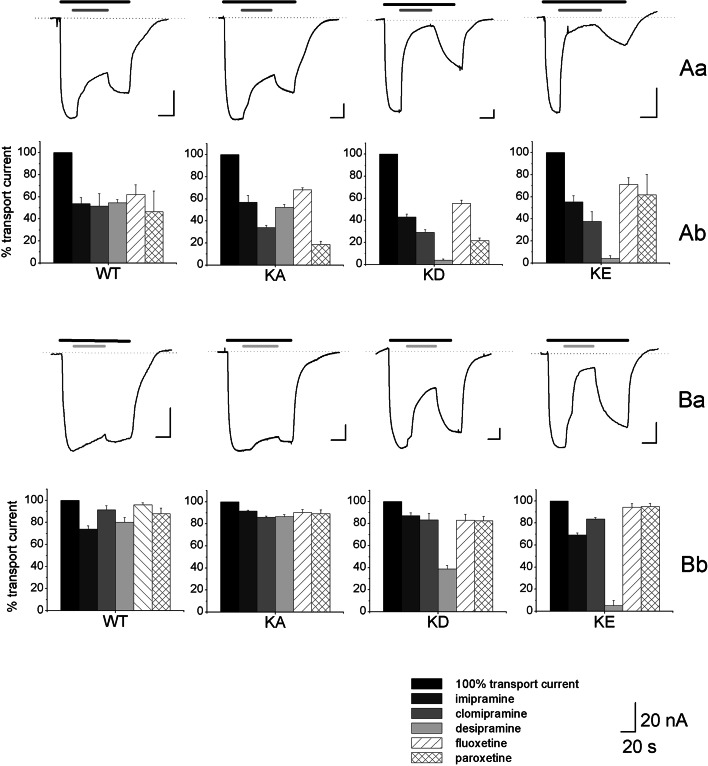
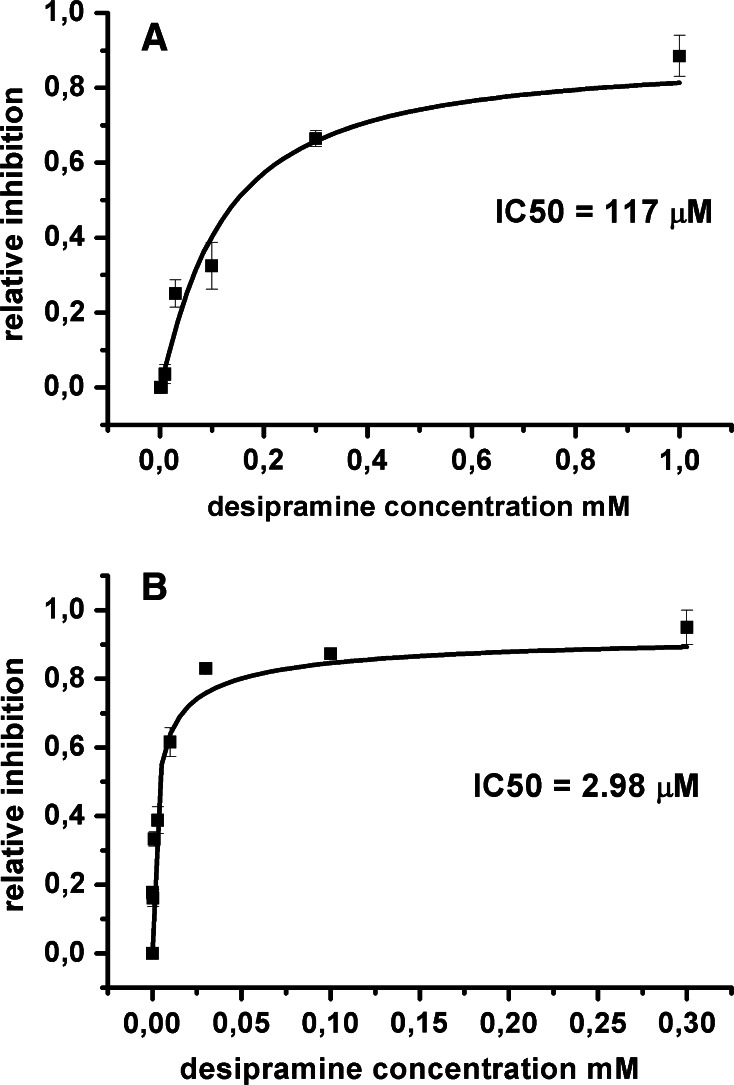
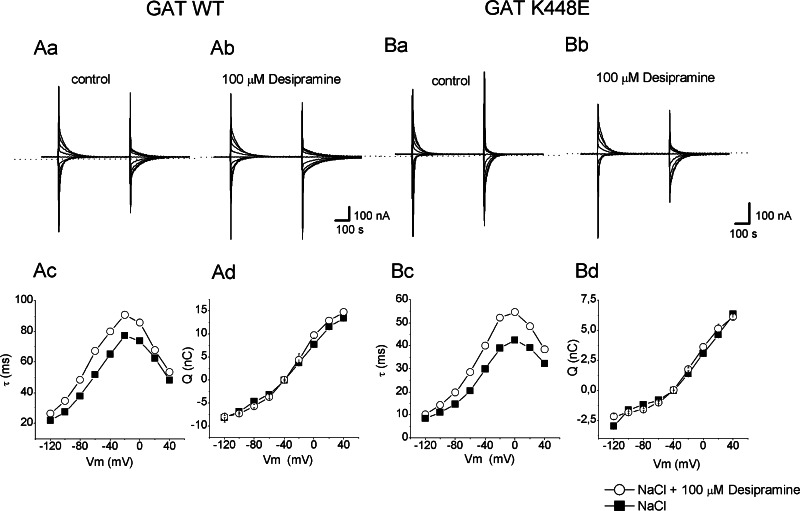
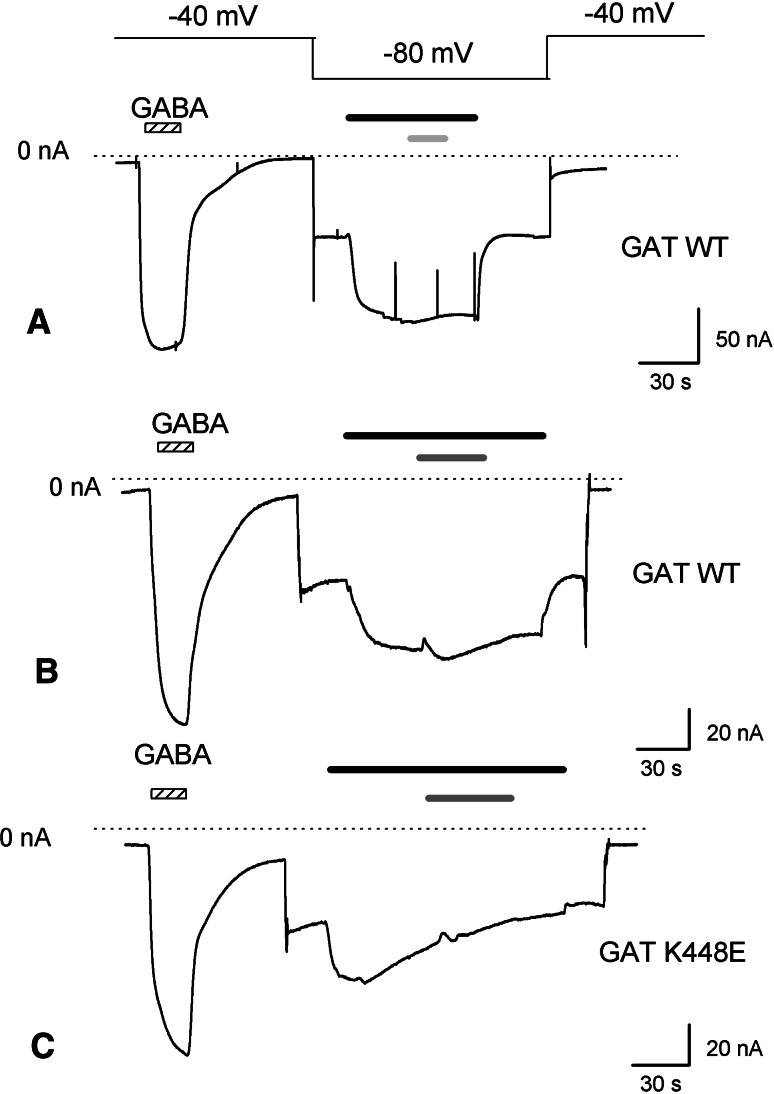
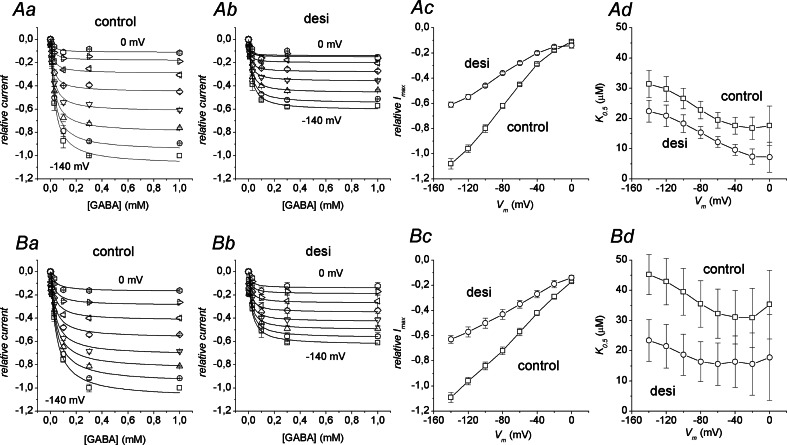
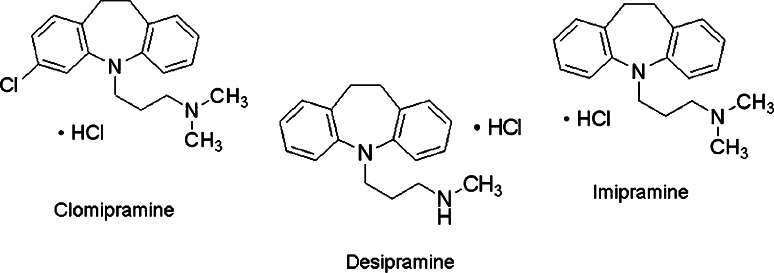
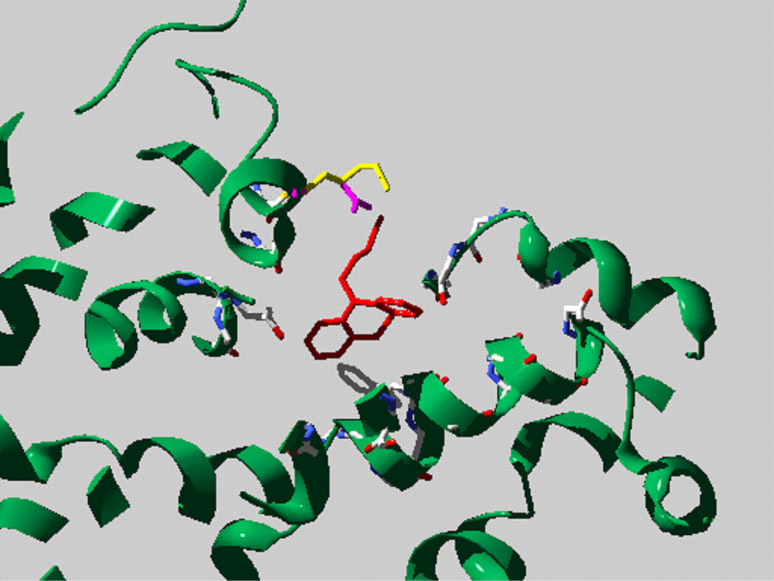
The effects of three tricyclic antidepressants (TCAs) and two serotonin selective reuptake inhibitors (SSRIs) have been studied with an electrophysiological approach on Xenopus laevis oocytes expressing the rat GABA (gamma-Aminobutyric-acid) transporter rGAT1. All tested TCAs and SSRIs inhibit the GABA-associated current in a dose-dependent way with low but comparable efficacy. The pre-steady-state and uncoupled currents appear substantially unaffected. The efficacy of desipramine, but not of the other drugs, is strongly increased in the lysine-glutamate or -aspartate mutants K448E and K448D. Comparison of I(max) and K(0.5GABA) in the absence and presence of desipramine showed that both parameters are reduced by the drug in the wild-type and in the K448E mutant. This suggests an uncompetitive inhibition, in which the drug can bind only after the substrate, an explanation in agreement with the lack of effects on the pre-steady-state and leak currents, and with the known structural data.


Figures

Fig. 1
Fig. 1
Representative recordings of inward currents at holding potential (V h) of −40 mV from rGAT1 wt expressing oocytes. GABA 300 μM (black bars) was perfused in sodium containing medium and imipramine (a), desipramine (b) and fluoxetine (c) (grey bars) were then added at three different concentrations (3, 30, 100 μM). The dotted line indicates the zero current level. As explained in the text, the changes in the holding current levels are due to an effect of the drug on endogenous K+ channels. The experiments were repeated at least three times with oocytes from two different donors
Fig. 2
Fig. 2
a Confocal images of HEK 293 cells transiently transfected with rGAT1-GFP. The fluorescent signal at the plasma membrane is relatively stable over time, before and after imipramine treatment: imipramine 100 μM was added between image at t = 0 and image at t = 10. b Mean fluorescence intensity measured at plasma membrane (white columns) and cytoplasm (black columns). Error bars ± SE, n = 4
Fig. 3
Fig. 3
Residual GABA transport current after application of the TCAs and SSRIs. In Aa and Ba, representative traces of GABA-dependent current inhibition exerted by 300 μM (Aa) and 30 μM (Ba) desipramine, from oocytes expressing from left rGAT1 wt, rGAT1 K448A, rGAT1 K448D and rGAT1 K448E. Black bars represent 300 μM GABA, dark grey bars 300 μM desipramine and light grey bars 30 μM desipramine. The dotted lines indicate the zero current level and the holding potential (V h) was kept at −40 mV. In Ab and Bb, histograms representing the percent of residual transport current after the application of three TCAs (imipramine, clomipramine and desipramine) and two SSRIs (fluoxetine and paroxetine) at concentrations of 300 μM (Ab) and 30 μM (Bb) on rGAT1 wt, rGAT1 K448A, rGAT1 K448D and rGAT1 K448E expressing oocytes are reported. The inhibitory effect was quantified by taking the ratio of the final current in presence of a given concentration of the drug to the current level elicited by GABA 300 μM just before application of the drug. Each condition was tested at least on four oocytes from two different batches
Fig. 4
Fig. 4
Dose-inhibition curve of desipramine on the GABA-induced current for rGAT1 wt (a) and rGAT1 K448E (b). The dose-inhibition curve was calculated from 8 oocytes (from at least two batches) for each drug concentration; data are mean ± SE and were obtained as the ratios of the current in presence of a given desipramine concentration to the current just before the drug application at the holding potential of −40 mV. The GABA concentration was always 300 μM
Fig. 5
Fig. 5
Effects of desipramine on pre-steady-state currents. Isolated pre-steady-state currents (PPS) elicited by voltage steps from V h = 40 mV (range −140 to +40 mV in 20 mV steps) from rGAT1 wt and rGAT1 K448E expressing oocytes in control solution (Aa for the wild-type and Ba for the K448E mutant) and after application of 100 μM desipramine (Ab rGAT1 wt; Bb rGAT1 K448E). The displaced amount of charge (Q) was obtained by integration of on and off transient currents and represented in function of voltage in absence (filled squares) and in presence of desipramine (open circles) for rGAT1 wt (Ad) and rGAT1 K448E (Bd). The decay time constant was obtained by a single exponential fitting of the PSS and plotted versus voltage in the absence (filled squares) and in the presence of desipramine (open circles) in the wild-type (Ac) and K448E mutant (Bc)
Fig. 6
Fig. 6
TCAs effect on rGAT1 wt and rGAT1 K448E uncoupled current recorded in lithium solution. Effect of the application of 100 μM imipramine (a) (light grey bar) or 100 μM desipramine (b, c) (dark grey bar) on the leakage current recorded from oocytes heterologously expressing rGAT1 wt (a, b) or rGAT1 K448E (c). The holding potential was moved to −80 mV to enhance the lithium current. The dotted line indicates the zero current level and the black bar represents 300 μM GABA
Fig. 7
Fig. 7
Effects of desipramine on the kinetic parameters. The top row refers to the wild type form, while the bottom row refers to the K448E mutant. Aa and Ab show dose-response curves in the absence and in the presence of 100 μM desipramine in the wild-type transporter; the different symbols correspond to different membrane potentials (from −140 mV, squares, to 0 mV, asterisks); Ba and Bb same for the K448E mutant. Each oocyte was tested in saturating (0.3 or 1 mM) and a single test GABA concentration (among 3, 10, 30 and 100 μM). Data points are means ± SE from at least four oocytes; on the whole, three different batches were used. All current determinations were normalised to the value in absence of desipramine at −140 mV and saturating GABA. Continuous curves are Hill’s equation fitting to the data. Ac and Ad I max and K 0.5 values from the fits for the wild-type form in the absence (squares) and in the presence (circles) of 100 μM desipramine. Bc and Bd same for the K448E mutant, except that the desipramine concentration was 3 μM. Note that the error bars in the I max and K 0.5 graphs do not represent SE of the mean, but are the standard errors arising from the fitting procedure
Fig. 8
Fig. 8
Structural formula of TCAs: clomipramine, desipramine and imipramine
Fig. 9
Fig. 9
Homology modelling of the putative TCA binding site of rGAT1 based on the LeuT–desipramine crystal structure, showing the positions of Lys 448 (yellow) and the Glu (magenta) substitution

References

    1. Singh SK, Yamashita A, Gouaux E. Antidepressant binding site in a bacterial homologue of neurotransmitter transporters. Nature. 2007;448:952–956. doi: 10.1038/nature06038. - DOI - PubMed
    1. Zhou Z, Zhen J, Karpowich NK, Goetz RM, Law CJ, Reith ME, Wang DN. LeuT-desipramine structure reveals how antidepressants block neurotransmitter reuptake. Science. 2007;317:1390–1393. doi: 10.1126/science.1147614. - DOI - PMC - PubMed
    1. Yamashita A, Singh SK, Kawate T, Jin Y, Gouaux E. Crystal structure of a bacterial homologue of Na+/Cl− dependent neurotransmitter transporters. Nature. 2005;437:215–223. doi: 10.1038/nature03978. - DOI - PubMed
    1. Paczkowski FA, Sharpe IA, Dutertre S, Lewis RJ. chi-Conotoxin and tricyclic antidepressant interactions at the norepinephrine transporter define a new transporter model. J Biol Chem. 2007;282:17837–17844. doi: 10.1074/jbc.M610813200. - DOI - PubMed
    1. Beuming T, Kniazeff J, Bergmann ML, Shi L, Gracia L, Raniszewska K, Newman AH, Javitch JA, Weinstein H, Gether U, Loland CJ. The binding sites for cocaine and dopamine in the dopamine transporter overlap. Nat Neurosci. 2008;11:780–789. doi: 10.1038/nn.2146. - DOI - PMC - PubMed

MeSH terms

Substances

LinkOut - more resources