. 2010 Mar;25(2):259-67.
doi: 10.1007/s10103-009-0723-y.

Apoptosis- and necrosis-induced changes in light attenuation measured by optical coherence tomography

Affiliations

Apoptosis- and necrosis-induced changes in light attenuation measured by optical coherence tomography

Freek J van der Meer et al. Lasers Med Sci. 2010 Mar.

Abstract

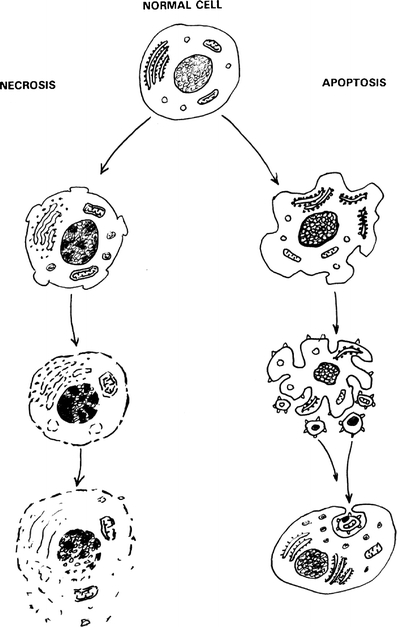
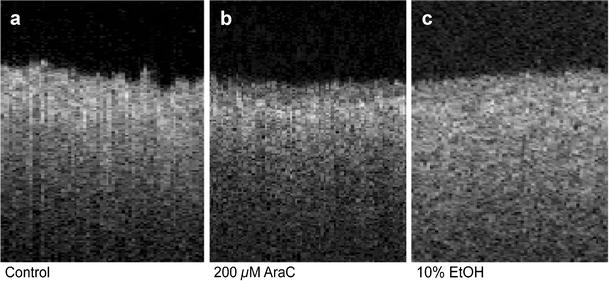
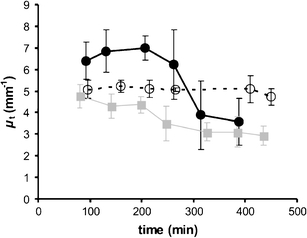
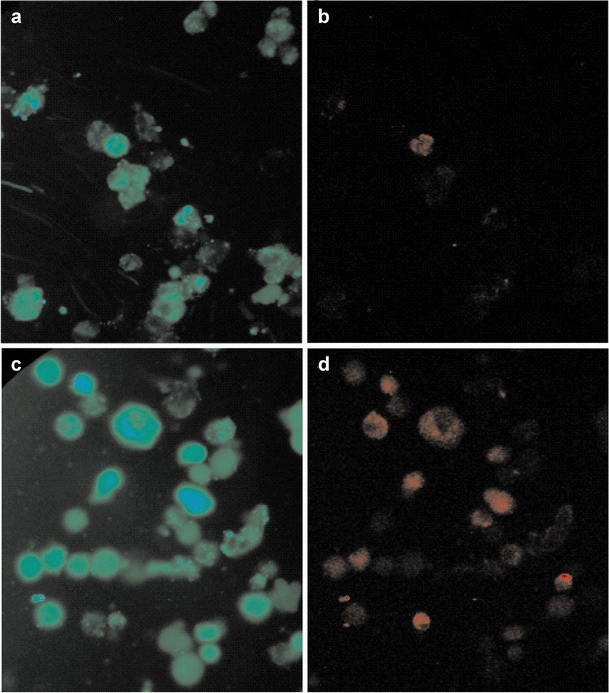
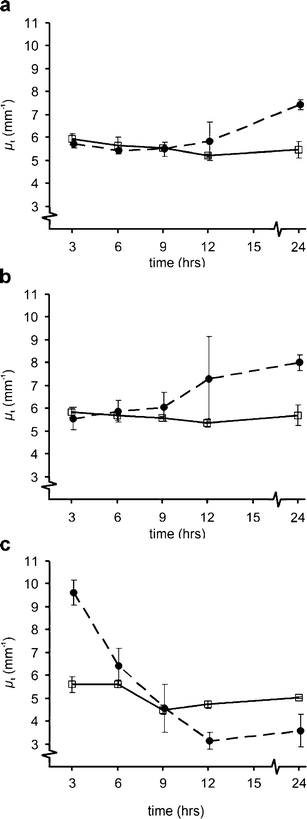
Optical coherence tomography (OCT) was used to determine optical properties of pelleted human fibroblasts in which necrosis or apoptosis had been induced. We analysed the OCT data, including both the scattering properties of the medium and the axial point spread function of the OCT system. The optical attenuation coefficient in necrotic cells decreased from 2.2 +/- 0.3 mm(1) to 1.3 +/- 0.6 mm(-1), whereas, in the apoptotic cells, an increase to 6.4 +/- 1.7 mm(-1) was observed. The results from cultured cells, as presented in this study, indicate the ability of OCT to detect and differentiate between viable, apoptotic, and necrotic cells, based on their attenuation coefficient. This functional supplement to high-resolution OCT imaging can be of great clinical benefit, enabling on-line monitoring of tissues, e.g. for feedback in cancer treatment.


Figures

Fig. 1
Fig. 1
Schematic representation of the different stages of necrosis (left) and apoptosis (right). The process of necrosis starts with membrane defects, followed by karyolysis and enzyme release, due to cell disintegration. Once apoptosis has been triggered in a normal cell (top), the membrane will change, leading to surface protrusions. The condensed nucleus fragments, which is followed by disintegration of the whole cell into apoptotic bodies, containing remnants of the nucleus and other cell components. Apoptotic bodies are cleared by phagocytosis by macrophages or neighbouring cells, or they undergo secondary necrosis
Fig. 2
Fig. 2
Examples of OCT images of pelleted cells. Untreated control cells (a) remained unchanged during the entire experiment. Apoptotic AraC-treated cells (b) showed an increase in scattering in the top layer, whereas necrosis (c) resulted in a decrease in signal
Fig. 3
Fig. 3
The attenuation coefficient measured in pelleted human fibroblasts, as a function of time. Time was measured in minutes from the point that the cells were forced into necrosis (filled squares) or apoptosis (filled dots). Sham-treated (control) cells show no change in scattering (circles)
Fig. 4
Fig. 4
Images of immunofluorescence labelling of control cells (a, b) and cells treated with 200 mM AraC (c, d) at 24 h. When the green fluorescing label CFDA (a, c) is used, viable cells can be identified, whereas the red fluorescing label AnnV (b, d) is specific for apoptotic cells. At 24 h, 5% of the control cells have become apoptotic, while, after treatment with 200 mM AraC, 61% of cells are apoptotic
Fig. 5
Fig. 5
After induction with 10% ethanol (t = 0), the number of viable cells (grey line, open dots) decreases and the number of necrotic cells (black line, filled dots) increases. The total number of cells (grey dotted line) decreases, due to loss of necrotic cells. The decrease in µt (black dotted line) coincides with the increase in necrosis
Fig. 6
Fig. 6
Dose-dependency curves of the increase in µt after treatment with 50 µM (a), 100 µM (b), and 200 µM (c) AraC. The higher the dose, the earlier is the onset of the µt increase. The black lines depict the untreated control cells, and the dotted lines are AraC-treated apoptotic cells
Fig. 7
Fig. 7
Colchicine-treated cells (black dotted line) mimic the µt curve of the AraC-treated cells (grey line). However, the maximum values of µt are higher, and secondary necrosis is not significantly detected. Untreated control cells are represented by the black line

References

    1. Vermes I, Haanen C. Apoptosis and programmed cell death in health and disease. Adv Clin Chem. 1994;31:177–246. doi: 10.1016/S0065-2423(08)60336-4. - DOI - PubMed
    1. Kerr JF, Wyllie AH, Currie AR. Apoptosis: a basic biological phenomenon with wide-ranging implications in tissue kinetics. Br J Cancer. 1972;26:239–257. - PMC - PubMed
    1. Thompson CB. Apoptosis in the pathogenesis and treatment of disease. Science. 1995;267:1456–1462. doi: 10.1126/science.7878464. - DOI - PubMed
    1. Vermes I, Haanen C, Reutelingsperger C. Flow cytometry of apoptotic cell death. J Immunol Methods. 2000;243:167–190. doi: 10.1016/S0022-1759(00)00233-7. - DOI - PubMed
    1. Blankenberg FG, Katsikis PD, Tait JF, Davis RE, Naumovski L, Ohtsuki K, Kopiwoda S, Abrams MJ, Darkes M, Robbins RC, Maecker HT, Strauss HW. In vivo detection and imaging of phosphatidylserine expression during programmed cell death. Proc Natl Acad Sci U S A. 1998;95:6349–6354. doi: 10.1073/pnas.95.11.6349. - DOI - PMC - PubMed

Publication types

LinkOut - more resources