Review
. 2009 Nov;26(11):2369-400.
doi: 10.1007/s11095-009-9958-3. Epub 2009 Sep 9.

At the biological modeling and simulation frontier

Affiliations
Review

At the biological modeling and simulation frontier

C Anthony Hunt et al. Pharm Res. 2009 Nov.

Abstract

We provide a rationale for and describe examples of synthetic modeling and simulation (M&S) of biological systems. We explain how synthetic methods are distinct from familiar inductive methods. Synthetic M&S is a means to better understand the mechanisms that generate normal and disease-related phenomena observed in research, and how compounds of interest interact with them to alter phenomena. An objective is to build better, working hypotheses of plausible mechanisms. A synthetic model is an extant hypothesis: execution produces an observable mechanism and phenomena. Mobile objects representing compounds carry information enabling components to distinguish between them and react accordingly when different compounds are studied simultaneously. We argue that the familiar inductive approaches contribute to the general inefficiencies being experienced by pharmaceutical R&D, and that use of synthetic approaches accelerates and improves R&D decision-making and thus the drug development process. A reason is that synthetic models encourage and facilitate abductive scientific reasoning, a primary means of knowledge creation and creative cognition. When synthetic models are executed, we observe different aspects of knowledge in action from different perspectives. These models can be tuned to reflect differences in experimental conditions and individuals, making translational research more concrete while moving us closer to personalized medicine.


Figures

Fig. 1
Fig. 1
Illustrated is the gap that exists between inductive, mathematical models and the wet-lab models used in biomedical research. For illustration purposes, model types, and the analytic and explanatory methods that use them, are arranged according to abstraction level versus biological character; in reality they are not independent. The arrangement of model types is discussed in the text. More abstract indicates a greater capability for simple and focused representation. More realistic indicates a greater capability for aggregating collections of facts. The biological axis (biomimetic) indicates the degree to which a model resembles and behaves, at some level of detail, like its wet-lab referent. An inductively defined, equation-based model, for example, can mimic time-course measures of an aspect of a biological system very well (high, aspect-specific biomimesis), but, as a complex algorithm implemented atop a numerical integrator, it is not at all realistic (yet the conceptual model to which it is tied may include some realistic features). An unvalidated agent-based model can implement detailed representations of almost any physiological process and yet be incapable of behaving like the referent in any particular context; hence, it exhibits high realism but little biomimicry. Models that can bridge the gap will be biomimetic analogues of their wet-lab counterparts; they can be used for evaluating explicit mechanistic hypotheses in the context of many aspects of the referent.
Fig. 2
Fig. 2
Model-referent relationships (adapted from Fig. 1 in (65)). Shown are relationships between wet-lab, perfused liver experiments (center), traditional PK models (left), and In Silico Liver (ISL) analogues, which have begun bridging the gap in Fig. 1. Center: Rat livers in an experimental context (as in (89)) are the referent systems. During experiments, hepatic components interact with transiting drug molecules to cause changes in a drug’s concentration-time profile. The system’s behaviors during the experiment are reflected in the collected data. Left: The researcher identifies patterns in the data: drug (and possibly metabolites) levels in the hepatic out-flow profile. From those data and prior knowledge, an abstract, mechanistic description of what is thought to have occurred is offered, thus establishing abstract, conceptual mappings from that description to hepatic mechanisms. One or more equation-based PK models are selected, they are believed to be capable of describing the time course patterns identified in the data. The equations are known to be consistent with an idealized version of the mechanistic description. There is a conceptual mapping from that description to the equations. Software is executed to simulate parameterized equation output, enabling a quantitative mapping from simulated output to PK data. Metrics specify the goodness of fit. Right: A plausible, abstract mechanistic description is hypothesized and specified; it is similar but not identical to the one on the left side. Software components are designed, coded, verified, and assembled, and connected guided by the mechanistic specifications. The product of the process is a collection of micro-mechanisms rendered in software. A clear, concretizable mapping—c—exists between in silico components and how they plug together, and 1) hepatic physiological and microanatomical details, and 2) drug interactions with those components. Execution gives rise to a working analogue. Its dynamics are observable and intended to represent (mapping b) corresponding dynamics (believed to occur) within the liver during an experiment. Mapping b is also concretizable. Simulation measures provide time series data that are intended to mimic corresponding liver perfusion measurements. Quantitative measures establish the similarity between the two outflow profiles (mapping a).
Fig. 3
Fig. 3
Shown are examples of phenotype overlap. The shaded areas illustrate sets of phenotypic attributes. There is overlap (clear, direct similarities) of some systemic attributes of MDCK cultures and corresponding epithelial cell attributes in mammalian tissues. In the non-overlapping regions the mapping between related attributes (and their generative mechanisms) is not straightforward. It is complex. An in silico, synthetic analogue of the class described on the right side in Fig. 2 can have a similar relationship to MDCK cultures. Grant et al. provide an example (86) in which cell components are quasi-autonomous. There is a set of operating principles along with component logic governing component interactions. Phenotypic attributes observed during execution are unique. Overlap (similarities) in phenotype between the analogue and MDCK cultures are intended to reflect similarities (but not precise matches) in components, mechanisms, and operating principles. A As in (86), the first analogue is simple and abstract. It validates when a set of its attributes are acceptably similar to a targeted set of MDCK culture attributes (area of overlap). As is the case with MDCK cultures relative to epithelial cells in mammalian tissues, the analogue will have attributes that have no MDCK counterparts (non-overlapping area). B Sequential, iterative refinement (see Fig. 12) of the first analogue leads to an improved analogue. Kim et al. provide an example (81). Its validation is achieved when an expanded set of its attributes are judged similar to an expanded target set of MDCK attributes.
Fig. 4
Fig. 4
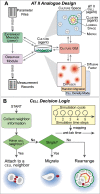
AT II analogue design and cell logic. A Shown is the AT II analogue design from (81). A hexagonal grid provides the space within which the four components interact. Cells are quasi-autonomous agents, which mimic AT II cell behaviors in vitro. Diffuser is a space to simulate diffusion of an abstract factor used to guide chemotaxis. The system-level components included experiment manager (the top-level system agent), observer (recorded measurements), and culture graphical user interface (GUI). B Simulation time advances in steps corresponding to simulation cycles. Each simulation cycle maps to an identical interval of wet-lab time; during a cycle, every culture component is given an opportunity to update. Every cell, selected randomly, decides what action to take based on its internal state (clustered or single) and the composition of its adjacent neighborhood. Enabled cell actions are cellcell attachment, cell migration, and rearrangement within a cluster. A cell within a cluster can rearrange with other cells composing the cluster, driven by a set of axiomatic operating principles (see (81) for specifics).
Fig. 5
Fig. 5
AT II analogues and AT II cell cultures can exhibit quantitatively similar, phenotypic attributes. A Mean ALC diameters, both in silico and wet-lab, are graphed as a function of initial cell density. Open circles: mean in vitro diameter after 5.7 days; vertical bars: ±1 SD (n = 25). Filled circles: mean analogue diameters after 100 simulation cycles (∼6.1 days); bars: ±1 SD (n = 100). The dominant migration mode was cell density-based. At initial densities of ≤ 2,000 cells 10–15% of cells moved randomly; at higher initial densities, movement was cell density-based. B Open circles: final, mean cluster count (averaged over three culture wells) for the in vitro experiments in A. Filled circles: final mean cluster count in A. C Phase-contrast pictures after 4 d in 2% Matrigel. Bar: ∼50 µm. D A sample image of simulated culture after 100 simulation cycles starting with 2,000 cells. Note that a hexagonal cyst within the discretized hexagonal space maps to a roundish cross-section through an ALC in vitro. Objects with white centers are cells. Gray and black spaces represent matrix and free (or luminal) space, respectively. E Shown are the consequences of changing cell speed cell in density-based mode. Speed (circled) is in grid units per simulation cycle; cells in A–D migrated 1 grid unit/cycle. Values are based on 100 Monte Carlo runs for 100 simulation cycles. The arrow pointing down shows the observed change in mean ALC diameter at the indicated initial cell density when Matrigel density was increased from 2% to 10%. Images adapted from (81).
Fig. 6
Fig. 6
Simulated human, adipose-derived, stromal cell (hASC) trafficking through the microvasculature during acute skeletal muscle ischemia (adapted from (87) with permission). The referent for the microvascular network was skeletal muscle visualized using confocal microscopy following harvest, using a 20× objective. A Confocal microscopy image of mouse spinotrapezius muscle immuno-stained to visualize epithelial cells having BS1-lectin antibody (white). Vascular structures of interest were copied (yellow). Arterioles and venules were characterized based on vessel diameter. Scale bar: 1 mm. B The network in A was manually discretized into nodes (bifurcation points, marked red). Nodes were connected to form elements. C Screen-shot of simulation space. Nodes and elements were manually constructed within a NetLogo simulation space to mimic the referent network in A. Red smooth muscle cells line arterioles and venules. Simulated hASHs that have successfully extravasated are green, otherwise they are white. Endothelial cells are yellow; tissue macrophages present within the interstitum are blue. D Illustration of the complex and dynamic connections between the four cell types. The listed, referent chemokines and cytokines have all been implicated in human ischemic injury. Arrows indicate connections between cell populations and denote some combination of the following: induced secretion, changes in cellular adhesion molecule expression, and/or integrin activation. All connections between nodes were based on relevant, independent, experimental literature. Images are adapted from (87).
Fig. 7
Fig. 7
Illustrated are hepatic lobular structures and their ISL counterparts. A A schematic of a cross-section of a hepatic lobule showing the direction of flow from the terminal protal vein tracts (PV) through sinusoids in three concentric zones to the central hepatic vein (CV). Different zones can have quantitative differences in structural and functional characteristics. B A portion of the sinusoid network is shown. It is an interconnected, three-zone, directed graph (lines connecting shown as circles). It maps to a portion of a lobular sinusoid network. Data from the literature are used to constrain the graph size and structure. Circles: sinusoidal segments (SS). C A schematic of a sinusoidal segment (SS): one SS occupies each node specified by the directed graph (in Fig. 7B). Grids map to hepatocyte spaces; they contain objects that map to intracellular functionality. From Grid A, they can access the other spaces. Grid locations have properties and that govern their interaction with mobile compounds. Different shadings of Grid A illustrate the potential for representing heterogeneous properties. Objects functioning as containers (for other objects) map to cells, and can be assigned to any grid location. D Shown are endothelial cell and hepatocyte. Objects representing all needed intracellular features can be placed within. Two types of intracellular binders recognize compounds: those that simply bind (binder) and those that also map to enzymes and can metabolize. Bile attributes can be represented easily when needed.
Fig. 8
Fig. 8
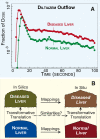
ISL properties. A Outflow profiles of normal and diseased ISLs are compared. Values are smoothed, mean diltiazem levels (fraction of dose per collection interval) from the normal and diseased ISL that achieved the most stringent, pre-specified Similarity Measure: >90% of simulated outflow were within a factor of 0.33 of corresponding wet-lab values. B Illustrated is a simple example of the model-to-model translational mapping mentioned in the “Introduction.” Eleven of 25 key ISL parameters’ values that were tuned to create the diltiazem outflow profile from a normal liver were altered to obtain the validated diltiazem outflow profile from a diseased liver. Three of the 11 were liver structure parameters. Their change mapped to disease-caused changes in referent liver micro-anatomical characteristics. Nine of the eleven were parameters governing movement and interaction of diltiazem with liver components, such as moving between spaces and the probability of metabolism after being bound to an enzyme. For the attributes targeted, intermediate ISL parameterizations (of those 11) can be used to document the incremental transformation of a normal to a diseased liver. The details of such a transformation provide a working, abstract hypothesis for the mechanisms of actual disease progression; they specify what must be changed (morphed) to translate results from one wet-lab model to another.
Fig. 9
Fig. 9
Temporal changes within comparable ISL micro-mechanisms. Dispositional events within an ISL from a variety of perspectives can be measured following dosing. Doing so gives an unprecedented view of plausible dispositional detail. Examples included measuring bound and unbound diltiazem within hepatocytes, number of metabolic events occurring within any one of the three Zones, or the fraction of dose within a particular Sinusoidal Segment (SS). The values graphed include the latter. Values graphed in A–D are the amounts of diltiazem in four different states: bound and unbound in hepatocytes, and bound and unbound in endothelial cells. A and B: a normal liver; C and D: a diseased liver; A and C: the focus is SS #14 in Zone 1; B and D: the focus is SS #33 in Zone 3.
Fig. 10
Fig. 10
Screenshots of Multi-Bilayer GutLung Axis (adapted from (18)). All illustrations are from (18) with permission. A Illustrated is the multiple bilayer topology of the interacting GutLung system. Letter a: the pulmonary bilayer; on top (aqua) is the layer of pulmonary epithelial cells. Each cell in this and the other layers is a separate agent. Below that (red) is the layer of pulmonary endothelial cells. Below that are spherical inflammatory cells. Letter b: the gut bilayer; the three, similarly configured layers are comprised of the same cell types as above. Top (pink): gut epithelial cells; middle: (red) gut endothelial cells; bottom: inflammatory cells. Circulating inflammatory CELLS move between the gut–lung bilayers. B Shown is an example of gut barrier dysfunction. The Gut–Lung system was run starting with pneumonia as the initial perturbation. Letter c: the localized injury to the pulmonary bilayer; letter d: the shaded areas demonstrate areas of the gut epithelial layer experiencing impaired tight junction protein metabolism due to gut ischemia from decreased systemic oxygenation arising from pulmonary edema. C Shown are the effects of gut ischemia on pulmonary occludin levels (serving as a proxy for pulmonary barrier dysfunction) after 72 h of an experiment that started with sub-lethal ischemia. Levels of both cytoplasmic and cell wall occludin levels reached a nadir at ∼24 h (not shown). Thereafter recovery progressed as inflammation subsided. Shades of gray: partially recovered pulmonary epithelial cells. D Shown are the pulmonary effects 72 h into an experiment that started with a lethal level of ischemia but also with supplementary oxygen to 50% (up from normal level of 21%), which added to the oxygen levels that could be generated by the damaged lung. Cytoplasm and cell wall occludin levels dropped to minimal levels by 12 h (not shown). The supplementary oxygen blunted the effects of pulmonary edema by keeping oxygen levels above the ischemic threshold for endothelial cell activation. Consequently, endothelial cells survived the interval of most intense inflammation and that allowed epithelial cells to begin recovering their tight junctions. Letter e: intact endothelial cell layer. Letter f: recovering pulmonary epithelial cells. Letter g: intact and recovering gut epithelial cells.
Fig. 11
Fig. 11
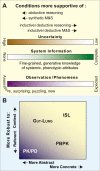
Analogue characteristics. A Conditions supportive of all three reasoning methods are sketched. Obviously, everyone associated with a pharmaceutical or biotechnology R&D effort would like knowledge about all wet-lab research systems to be rich and detailed, and for uncertainties to be limited. Such conditions (toward the far right side), which are common in non-biological, physical systems, favor developing inductive models that are increasingly precise and predictive. However, the reality is that we are most often on the left side, where frequent abduction is needed and synthetic M&S methods can be most useful. B Four different model types are characterized in terms of robustness to context or referent, as discussed in the text. In terms of components and variables (input/output), PK/PD models (like many inductive, equation-based models) and the gut–lung analogue are abstract enough to represent different families of referents, whereas the ISL and most PBPK models are more concrete and so less flexible.
Fig. 12
Fig. 12
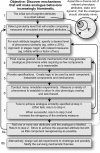
An iterative protocol for refining and improving synthetic analogues. Abductive reasoning may be required at steps 4–8. Induction and deduction occur during steps 5–7.

References

    1. Butcher EC, Berg EL, Kunkel EJ. Systems biology in drug discovery. Nat Biotechnol. 2004;22:1253–9. doi: 10.1038/nbt1017. - DOI - PubMed
    1. Butcher EC. Can cell systems biology rescue drug discovery? Nat Rev Drug Discov. 2005;4:461–7. doi: 10.1038/nrd1754. - DOI - PubMed
    1. van der Greef J, McBurney RN. Innovation: rescuing drug discovery: in vivo systems pathology and systems pharmacology. Nat Rev Drug Discov. 2005;4:961–7. doi: 10.1038/nrd1904. - DOI - PubMed
    1. Kola I. The state of innovation in drug development. Clin Pharmacol Ther. 2008;83:227–30. doi: 10.1038/sj.clpt.6100479. - DOI - PubMed
    1. Chien JY, Friedrich S, Heathman MA, de Alwis DP, Sinha V. Pharmacokinetics/Pharmacodynamics and the stages of drug development: role of modeling and simulation. AAPS J. 2005;7:E544–59. doi: 10.1208/aapsj070355. - DOI - PMC - PubMed