. 2009;12(3):297-301.
doi: 10.1007/s10456-009-9155-3.

Computer-aided quantification of retinal neovascularization

Affiliations

Computer-aided quantification of retinal neovascularization

A Stahl et al. Angiogenesis. 2009.

Abstract

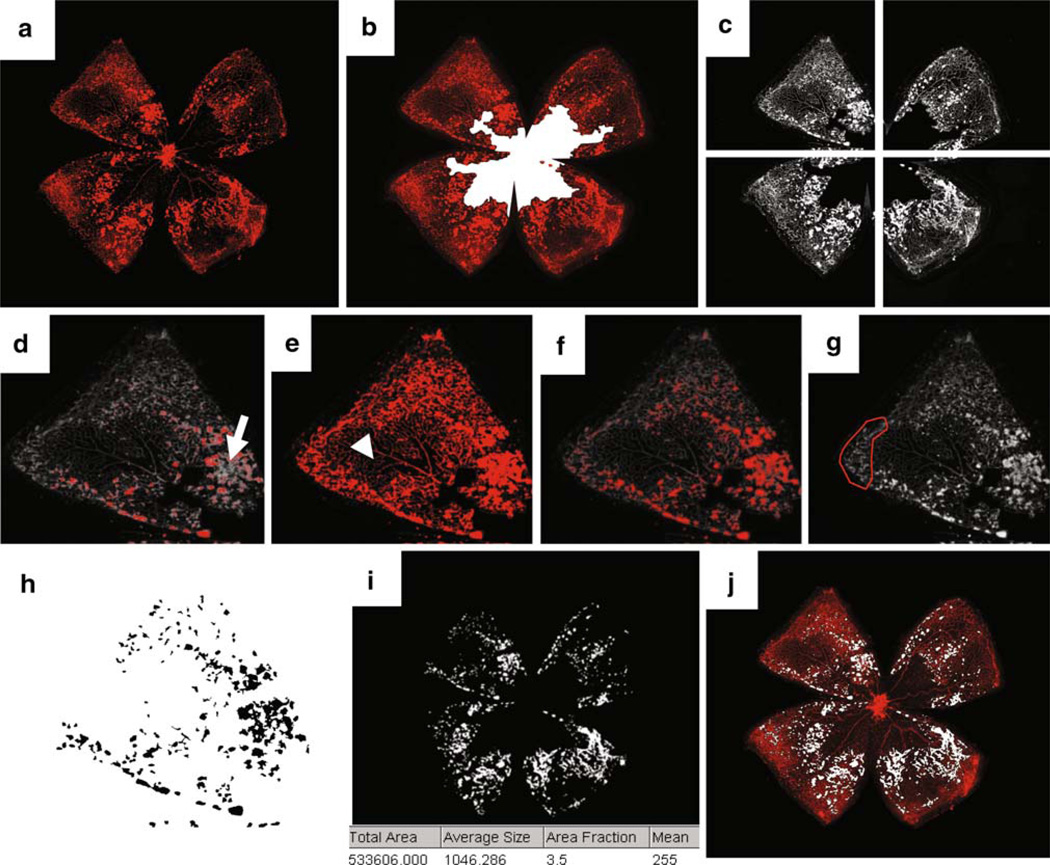
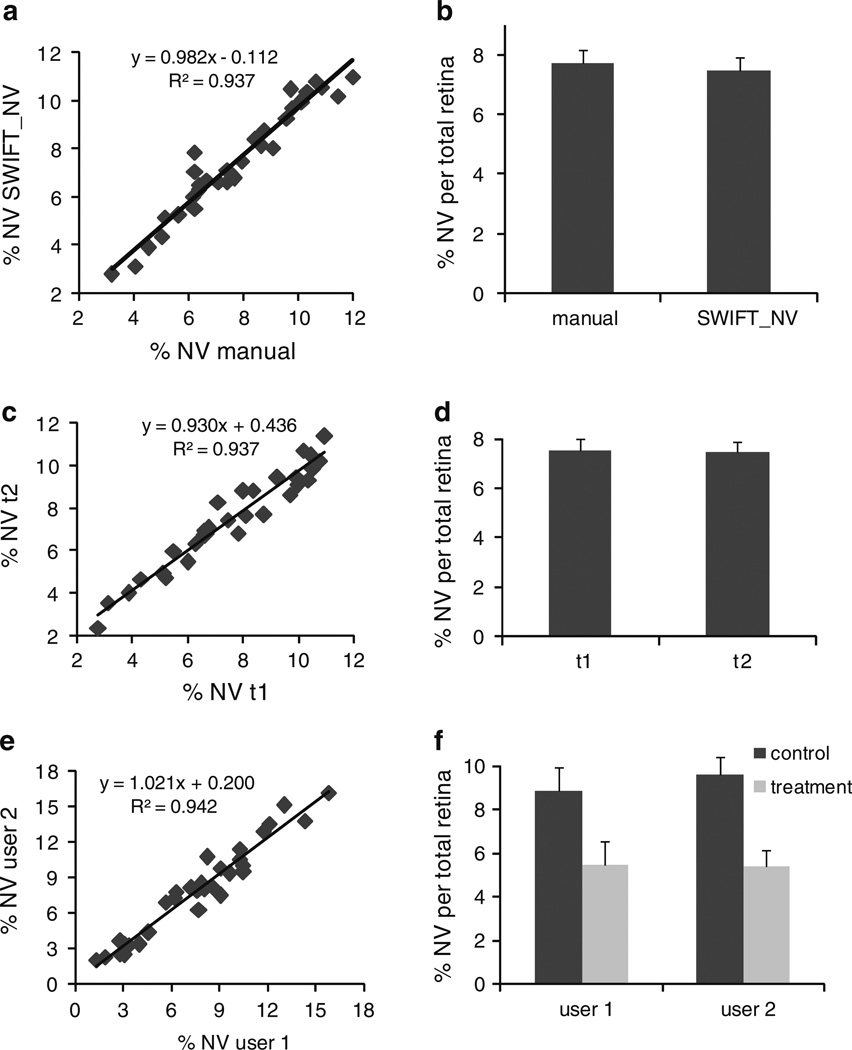
Rodent models of retinal angiogenesis play a pivotal role in angiogenesis research. These models are a window to developmental angiogenesis, to pathological retinopathy, and are also in vivo tools for anti-angiogenic drug screening in cancer and ophthalmic research. The mouse model of oxygen-induced retinopathy (OIR) has emerged as one of the leading in vivo models for these purposes. Many of the animal studies that laid the foundation for the recent breakthrough of anti-angiogenic treatments into clinical practice were performed in the OIR model. However, readouts from the OIR model have been time-consuming and can vary depending on user experience. Here, we present a computer-aided quantification method that is characterized by (i) significantly improved efficiency, (ii) high correlation with the established hand-measurement protocols, and (iii) high intra- and inter-individual reproducibility of results. This method greatly facilitates quantification of retinal angiogenesis while at the same time increasing lab-to-lab reproducibility of one of the most widely used in vivo models in angiogenesis research.


Figures

Fig. 1
Fig. 1
Lectin-stained retinal whole mounts showing the zone of vaso-obliteration (VO) and neovascularization (NV). After oxygen incubation a central VO zone develops (a) that is quantified by manually outlining the edges of the VO area (b). After returning the mouse pups to room air the hypoxic retina in the VO zone triggers formation of retinal NV (c). In the traditional hand-measurement protocols all neovascular tufts (arrowheads) and clusters (arrow) are manually marked to quantify retinal NV (d)
Fig. 2
Fig. 2
The computer-aided quantification method SWIFT_NV requires both the original retinal whole mount image (a) as well as an image with manually marked area of vaso-obliteration (VO; b). SWIFT_NVs algorithm automatically divides the retinal image into four quadrants and subtracts background fluorescence (c). During the next step the user is asked to set an intensity threshold for each quadrant individually. Setting the threshold too high misses NV tufts and clusters (arrow in d). Setting the threshold too low falsely includes normal vessels (arrowhead in e). Correct thresholding marks tufts and clusters, but not normal vessels (f). During this step the user can also manually mark areas that should be excluded from the quantification; i.e., hyperfluorescent retinal edges, remaining hyaloid vessels, or fluorescent debris (g). SWIFT_NV will then automatically quantify all pixels in the image that lie above the set threshold and are part of an object that has a minimum size of 100 pixels. By setting a cut-off in object size, small hyperfluorescent artifacts like vessel branchpoints get removed (h). After quantifying all four quadrants SWIFT_NV re-assembles the retinal image and displays the total number of NV pixels (i). Finally, an overlay of original image and NV image is created and automatically saved (j). The supplementary file in this article contains a movie showing SWIFT_NV quantification in realtime
Fig. 3
Fig. 3
Comparison between manual NV quantification and the SWIFT_NV method shows close correlation between the two methods over a wide range of NV (a). Mean values and standard error do not differ between manual measurement and SWIFT_NV quantification (b). Repeated measurements of the same data set by the same user after a 3-month time interval show high intra-individual reproducibility (c, d). The second quantification (t2) correlates well with the original measurements (t1; c). Mean value and standard error are almost exactly reproduced (d). Comparison of two users independently quantifying the same images shows high inter-individual correlation (e). Both users obtained almost identical values for the control and treatment group contained in the data set (f). All measurements were done on n = 30 retinas

References

    1. Kennedy D. Breakthrough of the Year. Science. 2006:1841. - PubMed
    1. Rosenfeld PJ, et al. Ranibizumab for neovascular age-related macular degeneration. N Engl J Med. 2006;355(14):1419–1431. - PubMed
    1. Ranieri G, et al. Vascular endothelial growth factor (VEGF) as a target of bevacizumab in cancer: from the biology to the clinic. Curr Med Chem. 2006;13(16):1845–1857. - PubMed
    1. Smith LE, et al. Oxygen-induced retinopathy in the mouse. Invest Ophthalmol Vis Sci. 1994;35(1):101–111. - PubMed
    1. Pierce EA, et al. Vascular endothelial growth factor/vascular permeability factor expression in a mouse model of retinal neovascularization. Proc Natl Acad Sci USA. 1995;92(3):905–909. - PMC - PubMed

Publication types