. 2009 Sep;17(3):425-34.
doi: 10.1016/j.devcel.2009.08.005.

A hierarchy of H3K4me3 and H3K27me3 acquisition in spatial gene regulation in Xenopus embryos

Affiliations

A hierarchy of H3K4me3 and H3K27me3 acquisition in spatial gene regulation in Xenopus embryos

Robert C Akkers et al. Dev Cell. 2009 Sep.

Abstract

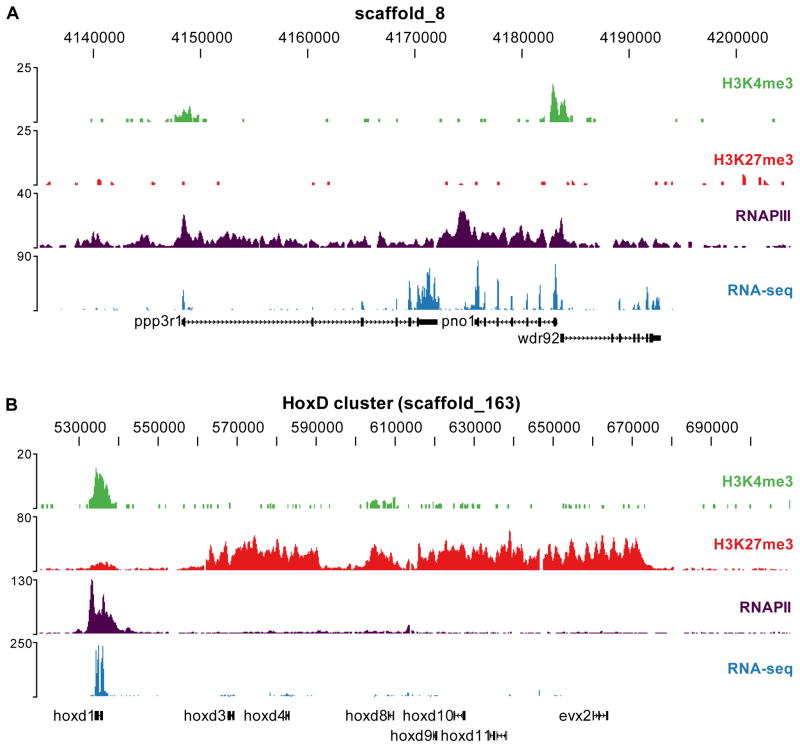
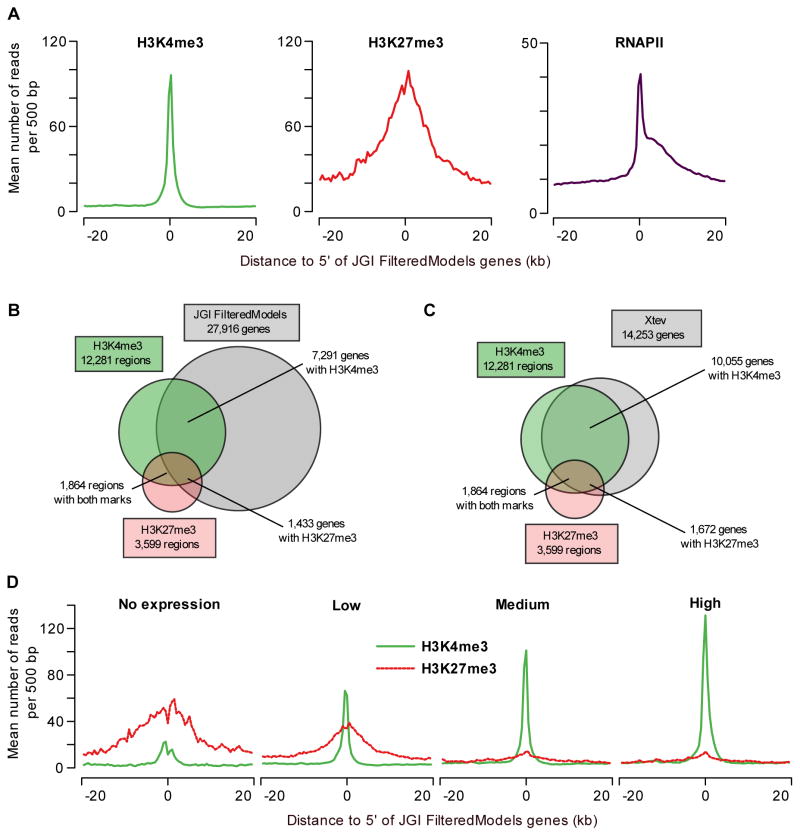
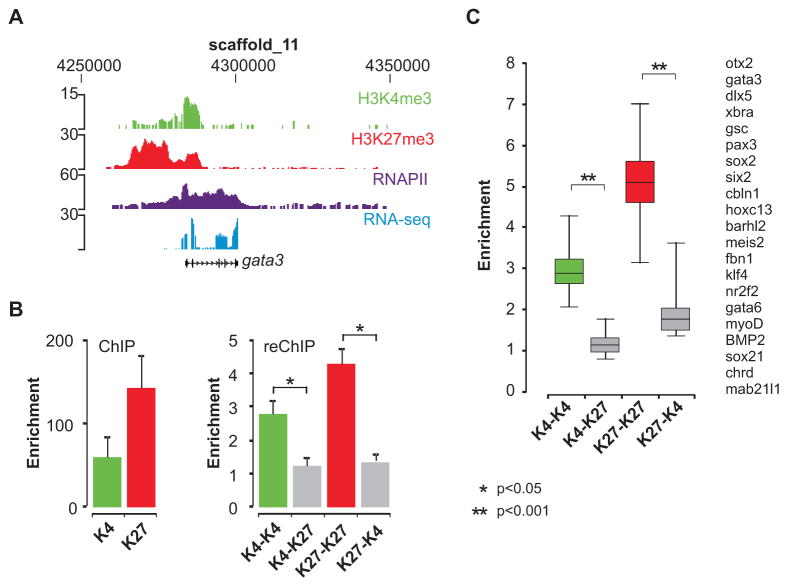
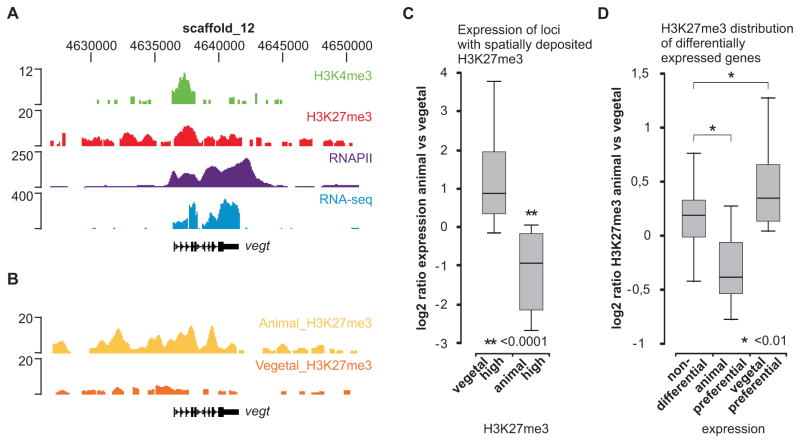
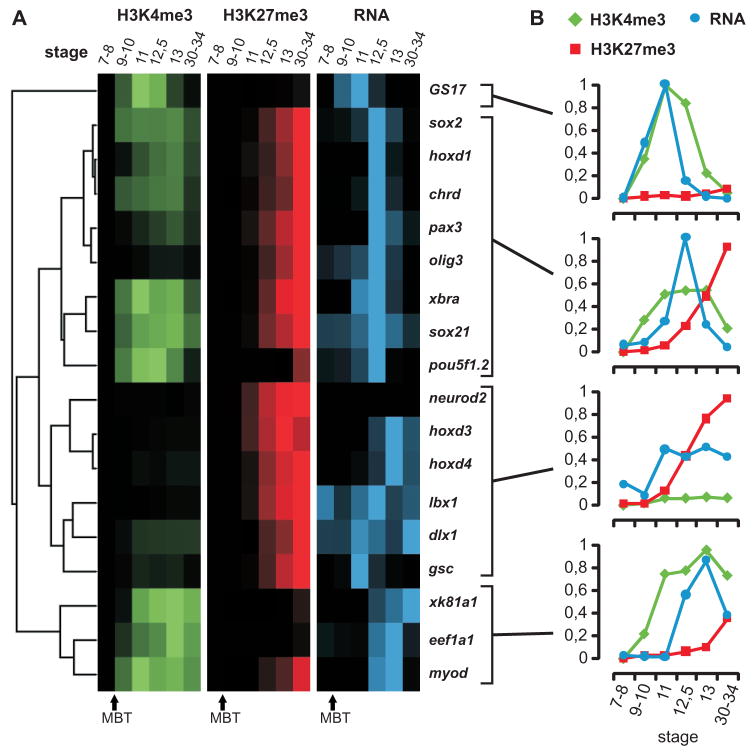
Epigenetic mechanisms set apart the active and inactive regions in the genome of multicellular organisms to produce distinct cell fates during embryogenesis. Here, we report on the epigenetic and transcriptome genome-wide maps of gastrula-stage Xenopus tropicalis embryos using massive parallel sequencing of cDNA (RNA-seq) and DNA obtained by chromatin immunoprecipitation (ChIP-seq) of histone H3 K4 and K27 trimethylation and RNA Polymerase II (RNAPII). These maps identify promoters and transcribed regions. Strikingly, genomic regions featuring opposing histone modifications are mostly transcribed, reflecting spatially regulated expression rather than bivalency as determined by expression profile analyses, sequential ChIP, and ChIP-seq on dissected embryos. Spatial differences in H3K27me3 deposition are predictive of localized gene expression. Moreover, the appearance of H3K4me3 coincides with zygotic gene activation, whereas H3K27me3 is predominantly deposited upon subsequent spatial restriction or repression of transcriptional regulators. These results reveal a hierarchy in the spatial control of zygotic gene activation.


Figures

Figure 1
Figure 1. Histone methylation profiles and the transcriptome of the Xenopus tropicalis gastrula embryo
Profiles of H3K4me3 (green), H3K27me3 (red), RNAPII (purple) and RNA-seq (blue) are visualized using the UCSC Genome Browser for two genomic regions. (A) The upper panel shows a region on scaffold_8 with three expressed genes (ppp3r1, pno1 and wdr92). (B) The lower panel shows the HoxD cluster on scaffold_163.
Figure 2
Figure 2. Primary data analysis and comparison to gene models
(A) Profiles of H3K4me3, H3K27me3 and RNAPII at annotated genes. The average H3K4me3 read coverage for genes with a H3K4me3-enriched region within 1kb of the JGI FM genes annotated 5′ end is shown in the left panel (mean number of reads per 500bp, green). The middle panel shows the equivalent for H3K27me3 (red) and the right panel for RNAPII (purple). (B) Overlap of H3K4me3- and H3K27me3-enriched regions with JGI FM genes (within 1kb of the annotated 5′ end). (C) Overlap of H3K4me3- and H3K27me3-enriched regions with Xenopus tropicalis experimentally validated genes (within 1kb of the annotated 5′ end). (D) H3K4me3 and H3K27me3 correlate with gene expression levels. JGI FM genes were divided in equal-sized groups based on normalized RNA-seq expression level (no, low, medium and high expression). For these groups H3K4me3 (green) and H3K27me3 (red-dotted) occupancy profiles (mean number of reads per 500bp) are shown.
Figure 3
Figure 3. Sequential ChIP experiments for genes enriched for H3K4me3 and H3K27me3
(A) The gata3 locus is visualized using the UCSC genome browser; H3K4me3 (green), H3K27me3 (red), RNAPII (purple) and RNA-seq (blue). (B) Enrichment of H3K4me3 and H3K27me3 in the first round of ChIP (left panel), calculated as the fold over the background of a negative locus. Sequential ChIP enables to examine the presence of two histone modifications at the same chromatin fragment. The eluted chromatin fraction of the first ChIP was used as the starting material for a second round of ChIP (reChIP). In the reChIP (right panel) enrichment was calculated relative to a beads-only (no antibody) control. This is the most relevant control to determine enrichment due to the relatively high background generated by residual antibody of the first ChIP reaction. Enrichment in the reChIP (K4–K27 and K27-K4, grey bars) was less than two-fold. ReChIP with the same antibody shows strong signals (K4-K4, green bars and K27-K27, red bars). Enrichment values are presented as the mean + SEM of five independent experiments. Asterisks indicate p value <0.05 (t-test). (C) ReChIP results for 21 double-marked genes visualized in a boxplot. Double asterisks indicate p value <0.001 (t-test).
Figure 4
Figure 4. H3K27me3 is linked to localized repression patterns
H3K27me3 marks genes spatially regulated along the dorso-ventral and animal-vegetal axis. Xenopus embryo explant microarray data (animal and vegetal cap, dorsal and ventral marginal zone) was compared to H3K4me3 and H3K27me3 occupancy at promoters of differentially regulated genes. H3K27me3 is enriched at 5′ ends of genes which are at least 2-fold higher expressed in the vegetal side of the embryo compared to the animal cap. Genes which are either preferentially expressed (2-fold difference) at the dorsal or at the ventral side of the embryo are also enriched for H3K27me3 at their 5′ end. Number of genes in these groups: animal 211; vegetal 201; dorsal 33; ventral 22; no differential expression 2955.
Figure 5
Figure 5. Spatial deposition of H3K27me3 is predictive of localized expression
(A) The vegt locus is visualized using the UCSC genome browser; H3K4me3 (green), H3K27me3 (red), RNAPII (purple) and RNA-seq (blue). (B) H3K27me3 ChIP-seq of animal and vegetal halves (stage 10–12). The vegt gene is most enriched for H3K27me3 in the animal hemisphere. (C) qRT-PCR expression ratio (animal/vegetal) of genes with animal-high (n=4) or vegetal-high (n=25) H3K27me3 (normalized H3K27me3 ChIP-seq ratio, 2Log > 1). (D) Normalized H3K27me3 ChIP-seq ratio (2Log animal/vegetal) of genes with expression differences: non-differential (n=195), animal preferential (n=9) and vegetal preferential genes (n=35). Numbers refer to genes that are both enriched for H3K27me3 in whole embryos and included in the microarray data (Zhao et al., 2008).
Figure 6
Figure 6. Dynamic regulation of epigenetic marks and gene expression during development
(A) Hierarchical clustering results of relative ChIP recoveries for H3K4me3 (green) and H3K27me3 (red) and RT-PCR for stages 7–34 of developmentally regulated genes (blue). Intensities of the signal show high or low ChIP enrichment and expression. (B) The panels show the average relative ChIP recoveries for H3K4me3 (green), H3K27me3 (red) and expression values (qRT-PCR in blue) of the corresponding stages 7–34 for the four clusters. ChIP signals represent the average of a biological duplicate experiment.

Comment in

  • The curious case of bivalent marks.
    Herz HM, Nakanishi S, Shilatifard A. Herz HM, et al. Dev Cell. 2009 Sep;17(3):301-3. doi: 10.1016/j.devcel.2009.08.014. Dev Cell. 2009. PMID: 19758552

References

    1. Almouzni G, Wolffe AP. Constraints on transcriptional activator function contribute to transcriptional quiescence during early Xenopus embryogenesis. The EMBO journal. 1995;14:1752–1765. - PMC - PubMed
    1. Azuara V, Perry P, Sauer S, Spivakov M, Jorgensen HF, John RM, Gouti M, Casanova M, Warnes G, Merkenschlager M, et al. Chromatin signatures of pluripotent cell lines. Nature cell biology. 2006;8:532–538. - PubMed
    1. Barski A, Cuddapah S, Cui K, Roh TY, Schones DE, Wang Z, Wei G, Chepelev I, Zhao K. High-resolution profiling of histone methylations in the human genome. Cell. 2007;129:823–837. - PubMed
    1. Bernstein BE, Mikkelsen TS, Xie X, Kamal M, Huebert DJ, Cuff J, Fry B, Meissner A, Wernig M, Plath K, et al. A bivalent chromatin structure marks key developmental genes in embryonic stem cells. Cell. 2006;125:315–326. - PubMed
    1. Bhaumik SR, Smith E, Shilatifard A. Covalent modifications of histones during development and disease pathogenesis. Nature structural & molecular biology. 2007;14:1008–1016. - PubMed

Publication types