. 2009 Nov 20;284(47):32914-31.
doi: 10.1074/jbc.M109.058610. Epub 2009 Sep 15.

SAGA and Rpd3 chromatin modification complexes dynamically regulate heat shock gene structure and expression

Affiliations

SAGA and Rpd3 chromatin modification complexes dynamically regulate heat shock gene structure and expression

Selena B Kremer et al. J Biol Chem. .

Abstract

The chromatin structure of heat shock protein (HSP)-encoding genes undergoes dramatic alterations upon transcriptional induction, including, in extreme cases, domain-wide nucleosome disassembly. Here, we use a combination of gene knock-out, in situ mutagenesis, chromatin immunoprecipitation, and expression assays to investigate the role of histone modification complexes in regulating heat shock gene structure and expression in Saccharomyces cerevisiae. Two histone acetyltransferases, Gcn5 and Esa1, were found to stimulate HSP gene transcription. A detailed chromatin immunoprecipitation analysis of the Gcn5-containing SAGA complex (signified by Spt3) revealed its presence within the promoter of every heat shock factor 1-regulated gene examined. The occupancy of SAGA increased substantially upon heat shock, peaking at several HSP promoters within 30-45 s of temperature upshift. SAGA was also efficiently recruited to the coding regions of certain HSP genes (where its presence mirrored that of pol II), although not at others. Robust and rapid recruitment of repressive, Rpd3-containing histone deacetylase complexes was also seen and at all HSP genes examined. A detailed analysis of HSP82 revealed that both Rpd3(L) and Rpd3(S) complexes (signified by Sap30 and Rco1, respectively) were recruited to the gene promoter, yet only Rpd3(S) was recruited to its open reading frame. A consensus URS1 cis-element facilitated the recruitment of each Rpd3 complex to the HSP82 promoter, and this correlated with targeted deacetylation of promoter nucleosomes. Collectively, our observations reveal that SAGA and Rpd3 complexes are rapidly and synchronously recruited to heat shock factor 1-activated genes and suggest that their opposing activities modulate heat shock gene chromatin structure and fine-tune transcriptional output.


Figures

FIGURE 1.
FIGURE 1.
A 2-bp mutation within HSE1 increases the dynamic range of hsp82 expression as well as Hsf1 promoter occupancy. A, HSP82 promoter sequence, numbered relative to the ATG start codon (+1), and the P2 and ΔURS1 promoter mutations evaluated in this study. ARE, ancillary repression element; STRE, stress-response element. B, Northern analysis of HSP82 and hsp82-P2 (strains SLY101 and DSG101, respectively; depicted are means ± S.E. of four independent assays). NHS, cells maintained at 30 °C; HS, cells shifted from 30 to 39 °C for 20 min. Transcript levels of HSP82 were assigned as 100 for NHS and 2000 for HS (13, 14, 22); hsp82-P2 mRNA levels are normalized relative to those of HSP82. C, in vivo cross-linking analysis of Hsf1 at HSP82 and hsp82-P2 at the indicated times following heat shock. Depicted is a PAGE analysis of multiplex PCRs of ChIPs using an Hsf1-specific polyclonal antibody. Input, DNA equivalent to 1% of the sonicated chromatin used in each IP sample (lanes 3–5 and 7–9). Mock, immunoprecipitation of an equivalent aliquot of chromatin mediated by Pansorbin cells alone. Depicted below is a bar graph summary of relative Hsf1 abundance with vertical lines representing the standard error; n = 4. Note that a level of 1.0 is >50-fold higher than the amount detected at either the PHO5 promoter or the HSP82 3′-UTR, neither of which bears HSEs.
FIGURE 2.
FIGURE 2.
Role for the Gcn5 and Esa1 HATs in enhancing HSP82 and hsp82-P2 transcription. A, Northern analysis of HSP82 under noninducing (30 °C; NHS) and inducing conditions (30–39 °C for 20 min; HS) in WT and the indicated isogenic deletion mutants (means ± S.E.; n = 4). HSP82 transcript levels in the WT background were set at 100 and 2000 for NHS and HS states, respectively. B, β-galactosidase (β-Gal) assays of hsp82-P2/lacZ in the indicated isogenic strains (means ± S.E.; n = 27 (WT) or 6 (all others)). NHS, cells maintained at 30 °C. HS, cells shifted from 30 to 39 °C for 45 min followed by 20 min at 30 °C. In a separate set of experiments, a set2Δ mutation diminished HS-induced expression of hsp82-P2/lacZ ∼2-fold while having no effect on NHS expression (J. Jeon and D. S. Gross, unpublished observations). C, Myc-H4 cross-linking analysis at the indicated regions within HSP82 in isogenic SAS3 and sas3Δ cells maintained at 30 °C or heat-shocked at 39 °C for 20 min (means ± S.D.; n = 2). D, Northern analysis of HSP82 expression in cells transformed with the plasmids pRS316 (SBK900), pGAL-Esa1 (SBK901), or pGAL-Esa1E338Q (SBK902). Induction of Esa1+ or Esa1E338Q was achieved by addition of 2% galactose for 12 h (+); one culture was maintained in 2% glucose (−). Cells were either maintained at 30 °C or shifted from 30 to 39 °C for 20 min as above (means ± S.E.; n = 4). As indicated, there exists a significant difference between the heat shock-induced expression of HSP82 in cells harboring an empty vector versus isogenic cells harboring the Esa1E338Q expression vector (p value determination made employing a two-tailed Student's t test (two-sample equal variance)). No significant difference exists in HSP82 transcript levels between cells transformed with the vector control and cells overexpressing Esa1+ (p > 0.1).
FIGURE 3.
FIGURE 3.
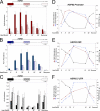
SAGA complex is rapidly recruited to the HSP82 promoter, ORF, and 3′-UTR in response to heat shock, where it mirrors the occupancy of pol II and anti-correlates with the presence of histone H3. A, in vivo cross-linking analysis of Spt3-TAP at HSP82 either prior to or for the indicated times during a 39 °C heat shock. For recovery, cells were heat-shocked at 39 °C for 20 min and then downshifted to 23 °C for 20 min. Midpoint coordinates of each amplicon are indicated. B, pol II occupancy of HSP82 at the indicated times, as assayed using a C-terminal domain-specific antibody. ChIPs were performed as in A. C, H3 abundance at HSP82 (relative its abundance at the PHO5 promoter) under the identical conditions, as assayed using an antibody raised against unacetylated H3. A–C, means ± S.E.; n = 4 independent samples. d–F, line graphs comparing SAGA (Spt3-TAP, red), pol II (Rpb1, blue), and histone H3 (black) abundance within the HSP82 promoter, ORF, and 3′-UTR at the indicated times.
FIGURE 4.
FIGURE 4.
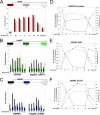
SAGA associates with both the promoter and coding region of SSA3 but is restricted to the promoter of HSP104. A, abundance of Spt3-TAP at the promoter and ORF of SSA3 at t = 0 min and the indicated times following heat shock. B, occupancy of pol II, as assayed in Fig. 3. C, H3 abundance at SSA3, as assayed in Fig. 3. D, cross-linking analysis of Spt3-TAP at four indicated regions within HSP104 at t = 0 min and the indicated times following heat shock. The increase in Spt3-TAP abundance seen within the coding region +HS does not appear to be significant (p > 0.1). E, occupancy of pol II at HSP104 as in B. F, abundance of H3 at HSP104 as in C. Depicted for all panels except C are means ± S.E.; n = 4 (C, means ± S.D.; n = 2). Midpoint coordinates of each amplicon are provided.
FIGURE 5.
FIGURE 5.
SAGA recruitment to the Hsf1 target genes CPR6 and SSA4. A, occupancy of Spt3-TAP at the promoter, ORF, and 3′-UTR of CPR6 at times both prior to and following heat shock. B, Spt3-TAP abundance at the promoter, ORF, and 3′-UTR of SSA4. Midpoint coordinates of each amplicon are indicated. Depicted for all panels are means ± S.E.; n = 4. The increased level of Spt3 detected within the ORF and 3′-UTR of SSA4 +HS appears significant (p < 0.001). C and D, SAGA is recruited to the Hsf1- and Msn2/Msn4-co-regulated genes, HSP26 and HSP12. Spt3-TAP abundance at HSP26 or HSP12 was monitored under the conditions indicated (n = 4 ± S.E. or n = 2 ± S.D., respectively).
FIGURE 6.
FIGURE 6.
Rpd3 suppresses both basal and induced hsp82 transcription. A, Northern analysis of the indicated hsp82 and rpd3 isogenic strains cultivated under NHS or HS conditions (means ± S.E.; n = 4). B, β-galactosidase (β-Gal) assays of hsp82-P2/lacZ in isogenic RPD3 and rpd3Δ strains cultivated under NHS or HS conditions as indicated (means ± S.E.; n = 27 (WT) or 6 (rpd3Δ)).
FIGURE 7.
FIGURE 7.
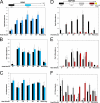
Sin3-containing complexes are robustly recruited to the HSP82 promoter and coding region in response to heat shock. A, Sin3-TAP ChIP analysis of the promoter, ORF, and 3′-UTR of HSP82 at the indicated times following heat shock. B, Sap30-TAP ChIP as in A, except isogenic HSP82 and hsp82URS1 strains were evaluated. C, Rco1-TAP ChIP as in B. Depicted in A–C are means ± S.E.; n = 3 or 4. D–F, line graphs comparing Sin3-TAP (red), Rpb1 (blue), and histone H3 (black) abundance within the indicated regions of HSP82 during a 60-min heat shock and following a 20-min recovery.
FIGURE 8.
FIGURE 8.
Sin3-containing complexes associate with both the promoter and coding region of heat shock-activated SSA3 and HSP104. A, ChIP analysis of Sin3-TAP abundance at SSA3 at 0 min and at the indicated times following heat shock. B, ChIP analysis of Sin3-TAP to the indicated regions of HSP104. A and B, means ± S.E. are depicted; n = 4. C–F, line graphs comparing the abundance of Spt3-TAP (red), Sin3-TAP (green), Rpb1 (blue), and histone H3 (black) within the HSP104 promoter and the indicated regions within its ORF either before or after thermal upshift or following a 20-min recovery from heat shock. Protein occupancies depicted in C–F represent composites derived from data presented in A and in D–F of Fig. 4.
FIGURE 9.
FIGURE 9.
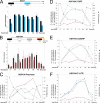
Rpd3 limits the extent to which histone H3 is evicted at HSP82, whereas URS1 suppresses H3 acetylation within the HSP82 promoter. A, histone H3 abundance at the indicated HSP82 regions as assayed by ChIP. Isogenic RPD3 and rpd3Δ strains were maintained at 30 °C or heat-shocked at 39 °C for 15 min. B, abundance of diacetylated H3 (AcK9 and AcK14), quantified relative to unacetylated H3, at HSP82 in cells cultivated as in A. C and D, as in A and B, except isogenic HSP82 and hsp82URS1 strains were used. In all panels, means ± S.E. are depicted; n = 3 or 4. Minor differences in apparent occupancy of histones for the WT strain (SLY101) in A versus C and B versus D may arise from the different composition of primer mixture used (see “Experimental Procedures”).
FIGURE 10.
FIGURE 10.
URS1, but not Rpd3, influences the binding of Hsf1 to the UASHS of HSP82. A, in vivo cross-linking analysis of Hsf1 at HSP82 in isogenic HSP82 and hsp82URS1 strains. B, as in A, except isogenic RPD3 and rpd3Δ strains under noninducing and 15-min heat shock-inducing conditions. In both panels, n = 4 (means ± S.E.). Hsf1 occupancy of the UASHS under NHS conditions is enhanced in the hsp82URS1 mutant (p < 0.02) although not in the rpd3Δ mutant (p > 0.1). Moreover, Hsf1 occupancy is significantly increased following heat shock in the WT strain (left bar pair in each panel; p < 0.004), although not in either mutant (p > 0.4 for hsp82URS1 and p > 0.3 for rpd3Δ). As in Fig. 9, minor differences in apparent occupancy of Hsf1 for the WT strain SLY101 (HSP82/RPD3) in A and B may arise from the different composition of primer mixture used.
FIGURE 11.
FIGURE 11.
Summary of SAGA, Rpd3(L), and Rpd3(S) complex occupancy at the wild-type HSP82 gene under NHS, acute HS, and prolonged HS states based on kinetic ChIP assays. The schematic emphasizes the main conclusions of this study as follows: (i) SAGA and Rpd3 complexes are both present at heat shock promoters under noninducing as well as inducing conditions; (ii) SAGA and Rpd3(S) are rapidly and synchronously recruited to select heat shock gene coding regions, including that of HSP82, in response to heat shock; and (iii) the abundance of HAT and histone deacetylase complexes is inversely proportional to nucleosomes throughout the length of the HSP82 gene under each condition. Asterisks indicate sequence-specific DNA binding subunits of Rpd3(L); Ume6 bears the pertinent DNA-binding activity toward URS1 (64).

References

    1. Morimoto R. I. (1998) Genes Dev. 12, 3788–3796 - PubMed
    1. Morimoto R. I. (2008) Genes Dev. 22, 1427–1438 - PMC - PubMed
    1. Dai C., Whitesell L., Rogers A. B., Lindquist S. (2007) Cell 130, 1005–1018 - PMC - PubMed
    1. Singh H., Erkine A. M., Kremer S. B., Duttweiler H. M., Davis D. A., Iqbal J., Gross R. R., Gross D. S. (2006) Genetics 172, 2169–2184 - PMC - PubMed
    1. Westwood J. T., Clos J., Wu C. (1991) Nature 353, 822–827 - PubMed

Publication types

MeSH terms

LinkOut - more resources