

Perinatal risk factors for childhood obesity and metabolic dysregulation
- PMID: 19759171
- PMCID: PMC2762159
- DOI: 10.3945/ajcn.2008.27416
Perinatal risk factors for childhood obesity and metabolic dysregulation
Abstract
Background: Childhood obesity has increased significantly in recent decades.
Objective: The objective was to examine the perinatal risk factors related to childhood obesity.
Design: In a prospective study, 89 women with normal glucose tolerance (NGT) or gestational diabetes mellitus (GDM) and their offspring were evaluated at birth and at 8.8 +/- 1.8 y. At birth, obstetrical data, parental anthropometric measures, and neonatal body composition were assessed; at follow-up, diet and activity were assessed and laboratory studies were conducted. Weight was classified by using weight for age and sex, and body composition was measured by using dual-energy X-ray absorptiometry. In childhood, data were analyzed as tertiles and prediction models were developed by using logistic and stepwise regression.
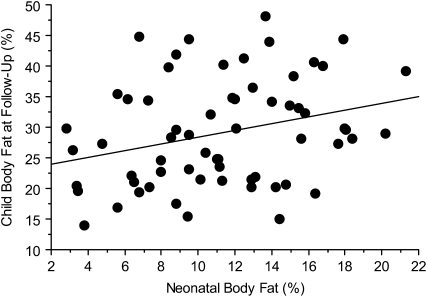
Results: No significant differences in Centers for Disease Control and Prevention weight percentiles, body composition, and most metabolic measures were observed between children of mothers with NGT and GDM at follow-up. Children in the upper tertile for weight had greater energy intake (P = 0.02), skinfold thickness (P = 0.0001), and leptin concentrations (P < 0.0001) than did those in tertiles 1 and 2. Children in the upper tertile for percentage body fat had greater waist circumference (P = 0.0001), insulin resistance (P = 0.002), and triglyceride (P = 0.009) and leptin (P = 0.0001) concentrations than did children in tertiles 1 and 2. The correlation between body fat at birth and follow-up was r = 0.29 (P = 0.02). The strongest perinatal predictor for a child in the upper tertile for weight was maternal pregravid body mass index (BMI; kg/m(2)) >30 (odds ratio: 3.75; 95% CI: 1.39, 10.10; P = 0.009) and for percentage body fat was maternal pregravid BMI >30 (odds ratio: 5.45; 95% CI: 1.62, 18.41; P = 0.006).
Conclusion: Maternal pregravid BMI, independent of maternal glucose status or birth weight, was the strongest predictor of childhood obesity.
Figures
References
-
- World Health Organization Obesity: preventing and managing a global epidemic. World Health Organ Tech Rep Ser 2000;899;1–4 - PubMed
-
- Flegal KM, Carroll MD, Ogden CL, Johnson CL. Prevalence and trends in obesity among U.S. adults, 1999-2000. JAMA 2002;288:1723–7 - PubMed
-
- Ogden CLC, Carroll MD, Curtin LR, McDowell MA, Tabac CJ, Flegal KM. Prevalence of overweight and obesity in the United States, 1999-2004. JAMA 2006;295:1549–55 - PubMed
Publication types
MeSH terms
Grants and funding
LinkOut - more resources
Full Text Sources
Other Literature Sources
Medical
