. 2009 Nov;20(21):4541-51.
doi: 10.1091/mbc.e09-03-0227. Epub 2009 Sep 16.

Sox9 family members negatively regulate maturation and calcification of chondrocytes through up-regulation of parathyroid hormone-related protein

Affiliations

Sox9 family members negatively regulate maturation and calcification of chondrocytes through up-regulation of parathyroid hormone-related protein

Katsuhiko Amano et al. Mol Biol Cell. 2009 Nov.

Abstract

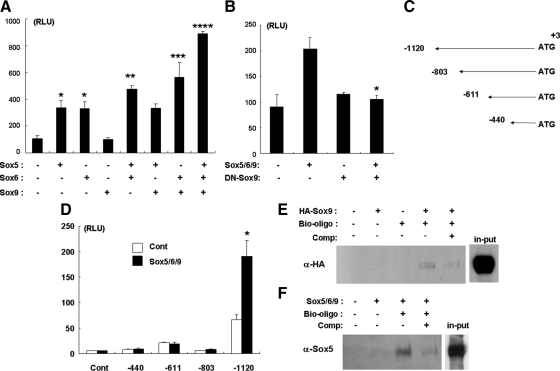
Sox9 is a transcription factor that plays an essential role in chondrogenesis and has been proposed to inhibit the late stages of endochondral ossification. However, the molecular mechanisms underlying the regulation of chondrocyte maturation and calcification by Sox9 remain unknown. In this study, we attempted to clarify roles of Sox9 in the late stages of chondrocyte differentiation. We found that overexpression of Sox9 alone or Sox9 together with Sox5 and Sox6 (Sox5/6/9) inhibited the maturation and calcification of murine primary chondrocytes and up-regulated parathyroid hormone-related protein (PTHrP) expression in primary chondrocytes and the mesenchymal cell line C3H10T1/2. Sox5/6/9 stimulated the early stages of chondrocyte proliferation and development. In contrast, Sox5/6/9 inhibited maturation and calcification of chondrocytes in organ culture. The inhibitory effects of Sox5/6/9 were rescued by treating with anti-PTHrP antibody. Moreover, Sox5/6/9 bound to the promoter region of the PTHrP gene and up-regulated PTHrP gene promoter activity. Interestingly, we also found that the Sox9 family members functionally collaborated with Ihh/Gli2 signaling to regulate PTHrP expression and chondrocyte differentiation. Our results provide novel evidence that Sox9 family members mediate endochondral ossification by up-regulating PTHrP expression in association with Ihh/Gli2 signaling.


Figures

Figure 1.
Figure 1.
Induction of PTHrP by Sox9 family members in C3H10T1/2. (A) C3H10T1/2 was infected with adenoviruses carrying Sox5, Sox6, and HA-tagged Sox9 (HA-Sox9) at 40 moi and cultured for 2 d. Expression of each Sox protein after infection of the adenoviruses was examined by immunoblotting with anti-Sox5 (top), anti-Sox6 (middle), or anti-HA antibody (bottom). (B–D) C3H10T1/2 cells infected with control (Cont) or Sox5/6/9 adenoviruses were cultured for 3 d. Total RNA isolated from the cells was determined by real-time PCR analyses for Col2α1 (B), Aggrecan (C), and PTHrP (D). (E) C3H10T1/2 cells infected with adenovirus carrying Myc-tagged dominant-negative Sox9 (DN-Sox9) at 40 moi were cultured for 2 d. Expression of DN-Sox9 was examined by immunoblotting with anti-Myc antibody. (F) C3H10T1/2 cells infected with control (Cont) or dominant-negative Sox9 (DN-Sox9) adenovirus were cultured for 3 d. Total RNA of the cells was subjected to real-time PCR analysis for PTHrP. Data represent mean ± SD (n = 3). *p < 0.01 vs. control; Student's t test.
Figure 2.
Figure 2.
Induction of PTHrP by Sox9 in murine primary chondrocytes. (A–C) Primary chondrocytes were infected with control (Cont) or HA-Sox9 adenoviruses at 40 moi and cultured for 3 d. Total RNA isolated from the cells was determined by real-time PCR analyses for Col2α1 (A), Sox5 (B), and Sox6 (C). (D) Primary chondrocytes infected with the adenoviruses (40 moi) as indicated were cultured for 3 d. Total RNA isolated from the cells was determined by real-time PCR analyses for PTHrP. (E) Primary chondrocytes infected with control (Cont) or DN-Sox9 adenovirus at 40 moi were cultured for 3 d. Total RNA of the cells was determined by real-time PCR analysis for PTHrP. Data represent mean ± SD (n = 3). *p < 0.01, **p = 0.01, ***p < 0.05 vs. control; Student's t test.
Figure 3.
Figure 3.
Inhibition of calcification by Sox9 family members in primary chondrocytes. (A and B) Primary chondrocytes cultured with or without BMP2 (100 ng/ml) were infected with control (Cont) or Sox5/6/9 adenoviruses, cultured for 7 d, and stained with alizarin red (A). Alizarin red–positive area of the cells was measured by Image Proplus (B). Data represent mean ± SD (n = 3). *p < 0.01 vs. BMP2; one-way ANOVA. (C) Primary chondrocytes infected with control (Cont) or HA-Sox9 adenovirus at 40 moi were cultured for 3 d. Total RNA of the cells was determined by real-time PCR analyses for ALP. Data represent mean ± SD (n = 3). *p < 0.01 vs. control; Student's t test. (D) Primary chondrocytes were placed at a density of 10 × 104/well of 24-multiwell plates. The cells were infected with control (Cont) or HA-Sox9 adenovirus and cultured for 3 d. MTT assay was performed to evaluate proliferation of the cells. Data represent mean ± SD (n = 4). *p < 0.05 vs. control; Student's t test. (E and F) Primary chondrocytes cultured with or without BMP2 (100 ng/ml) were treated with or without PTHrP (5 × 10⁻⁸ M) for 7 d and then stained by alizarin red (E). The alizarin red–positive area of the cells was measured with Image Proplus (F). Data represent mean ± SD (n = 3). *p < 0.01 vs. BMP2; one-way ANOVA.
Figure 4.
Figure 4.
Suppression of calcification of chondrocytes by Sox9 family members in organ culture. (A) Mouse metatarsals isolated from 15.5-d-old embryo (E15.5), 1 d after birth (P1), and 14-d-old mice (P14) were observed under a dissecting microscope (top). Metatarsals were histologically analyzed by H&E staining (bottom, magnification, ×100). Bars (top) show calcified region. R, resting zone; P, proliferating zone; H, hypertrophic zone; C, calcified zone; S, secondary ossified area. (B) Mouse metatarsal explants isolated from E15.5 embryo were cultured for 6 and 12 d and then macroscopically (top) and histologically (bottom; magnification, ×100) examined. Bars (top) show calcified region. R, resting zone; P, proliferating zone; H, hypertrophic zone; C, calcified zone; S, secondary ossified area. (C) Mouse metatarsal explants isolated from E15.5 embryo were infected with control (Cont) or HA-Sox9, Sox5, and Sox6 adenoviruses at 80 moi and cultured for 12 d. Organ cultured metatarsals were immunostained with anti-HA antibody. (D) Mouse metatarsal explants isolated from E15.5 embryo were infected with control (Cont) or Sox5/6/9 adenoviruses at 80 moi and cultured for 12 d. Left, red bars, calcified area; black arrows, secondary ossification. Right, longitudinal length and calcified zone were measured under a microscope. Data represent mean ± SD (n = 12). *p < 0.01 vs. control; Student's t test.
Figure 5.
Figure 5.
Stimulation of PTHrP expression and suppression of chondrocyte maturation of by Sox9 family members in organ culture. (A) Organ-cultured metatarsals were histologically analyzed by H&E staining and immunostained with anti-Col2 and anti-Col10 antibodies. S, secondary ossified region; H+C, hypertrophic and calcified areas. Red bars, immunostained areas. Magnification, ×100. (B) Metatarsals infected with green fluorescent protein (GFP) adenovirus or Sox5/6/9 adenoviruses were cultured for 12 d. The cultured metatarsals were frozen with dry ice for a moment and ground with lysis buffer to isolate mRNA. Total RNA of the cells was subjected to real-time PCR analysis for PTHrP (left), Col2a1 (middle), and Col10a1 (right) expression. p < 0.01 vs. GFP control; Student's t test. (C) Organ cultured metatarsals infected with control (Cont) or Sox5/6/9 adenoviruses were histologically analyzed by immunostaining with anti-PTHrP antibodies. No Ab, not incubated with PTHrP primary antibody. Magnification, ×100. (D) Organ cultured metatarsals infected with control (Cont) or Sox5/6/9 adenoviruses were subjected to ALP staining. Magnification, ×100. (E and F) Organ-cultured metatarsals were subjected to BrdU and DAPI staining (E), and BrdU-positive chondrocytes were counted and normalized by DAPI-stained chondrocytes present at the resting and proliferating zone (F). Magnification, ×100. Bars, immunostained areas. Data represent mean ± SD (n = 3). *p < 0.05 vs. control; Student's t test.
Figure 6.
Figure 6.
Rescue of chondrocyte maturation and calcification by anti-PTHrP antibody. (A) Metatarsals infected with control (Cont) or Sox5/6/9 adenovirus were cultured for 12 d with or without anti-PTHrP-antibody (193 μg/ml). Organ-cultured metatarsals were photographed (left; blue bars, calcified area; black arrows, secondary ossification) and measured (right). Data represent mean ± SD (n = 5). N.S., no significant difference between Sox5/6/9 and Sox5/6/9+Anti-PTHrP. *p < 0.01 versus Sox5/6/9 **p < 0.05 versus control; one-way ANOVA. (B and C) The organ-cultured metatarsals shown in A were subjected to H&E staining (B) and immunostained with anti-Col10 antibody (C). S, secondary ossification; H+C, hypertrophic and calcified areas. Red bars, immunoreactive area. Magnification, ×100.
Figure 7.
Figure 7.
Regulation of the PTHrP gene promoter by Sox9 family members. (A) Cos7 cells were transfected with a PTHrP gene promoter luciferase (1120 bp) and TK-renilla luciferase constructs together with empty vector (Cont) or Sox5, Sox6, or Sox9 expression vectors, as indicated. After 48 h, luciferase activity of the cell lysates was measured. Transfection efficiency was normalized by renilla luciferase activity. Data represent mean ± SD (n = 4). *p < 0.01 (vs. control), **p < 0.05 (vs. Sox5 or Sox6), ***p < 0.01 (vs. Sox6 or Sox9), ****p < 0.01 (vs. Sox5+Sox6, or Sox6+Sox9); one-way ANOVA. (B) Cos7 cells were transfected with PTHrP gene promoter luciferase (1120 bp) and TK-renilla luciferase constructs with empty vector (Cont) or a combination of Sox5/6/9 or dominant-negative (DN)-Sox9 expression vector as indicated. After 48 h, luciferase activity of the cell lysates was measured. Transfection efficiency was normalized by renilla luciferase activity. Data represent mean ± SD (n = 4). *p < 0.01 vs. Sox5/6/9; one-way ANOVA. (C) Schematic diagram of a series of human PTHrP gene promoter luciferase constructs. (D) Cos7 cells were transfected with a series of PTHrP gene promoter luciferase and TK-renilla luciferase constructs together with empty vector (Cont) or combination of Sox5/6/9 as indicated. After 48 h, luciferase activity of the cell lysates was measured. Transfection efficiency was normalized by renilla luciferase activity. Data represent mean ± SD (n = 4). *p < 0.01 vs. control, −440, −611 and −803; two-way ANOVA. (E) Lysates of BOSC23 transfected with empty or HA-Sox9 vector were incubated with biotinylated oligonucleotide (Bio-oligo) containing a putative Sox9 binding element of the PTHrP gene promoter. After precipitation with streptavidin beads, associated proteins with the oligonucleotide were determined by immunoblotting with anti-HA antibody. Comp, competition with 40-fold of nonbiotinylated oligonucleotide. (F) Lysates of C3H10T1/2 infected with control or Sox5/6/9 adenoviruses were incubated with biotinylated oligonucleotide (Bio-oligo) containing a putative Sox9-binding element of the PTHrP gene promoter. After precipitation with streptavidin beads, associated proteins with the oligonucleotide were determined by immunoblotting with anti-Sox5 antibody. Comp, competition with 40-fold nonbiotinylated oligonucleotide.
Figure 8.
Figure 8.
No effects of Sox9 on Ihh and Patched 1 expression in primary chondrocytes. (A) Primary chondrocytes infected with control (Cont) or Ihh adenovirus were cultured in the presence or absence of cyclopamine (Cy; 5 μM) for 3 d. Total RNA of the cells was determined by real-time PCR analysis for PTHrP (left) and Patched1 (right). Data represent mean ± SD (n = 3). *p < 0.01 vs. control; one-way ANOVA, **p < 0.01 vs. Ihh by one-way ANOVA. (B) Primary chondrocytes infected with control (Cont) or HA-Sox9 adenovirus were cultured with or without cyclopamine (5 μM) for 3 d. Total RNA of the cells was determined by real-time PCR analysis for PTHrP. Data represent mean ± SD (n = 3). ***p < 0.05 vs. Sox9; one-way ANOVA. (C) Primary chondrocytes infected with control (Cont) or HA-Sox9 adenovirus were cultured for 3 d. Total RNA of the cells was determined by real-time PCR analysis for Ihh. N.S., no significant difference; Student's t test. (D) Primary chondrocytes infected with control (Cont) or Sox9 adenovirus were cultured in the presence or absence of cyclopamine (Cy; 5 μM) for 3 d. Total RNA of the cells was determined by real-time PCR analysis for Patched1. Data represent mean ± SD (n = 3). N.S., no significant difference as determined; one-way ANOVA.
Figure 9.
Figure 9.
Functional cooperation of Sox5/6/9 and Ihh/Gli2 signaling in regulation of PTHrP expression. (A) Cos7 (left) or ATDC5 cells (right) were transfected with a PTHrP gene promoter luciferase (1120 bp) and TK-renilla luciferase constructs with empty vector (Cont), Gli1, Gli2, or Gli3 vectors. After 48 h, luciferase activity of the cell lysates was measured. Transfection efficiency was normalized by renilla luciferase activity. Data represent mean ± SD (n = 4). *p < 0.01 or **p < 0.05; one-way ANOVA (vs. control, Gli1, and Gli3). (B) Cos7 cells were transfected with a series of PTHrP gene promoter luciferase and TK-renilla luciferase constructs together with empty (Cont) or Gli2 vector. After 48 h, luciferase activity of the cell lysates was measured. Transfection efficiency was normalized by renilla luciferase activity. Data represent mean ± SD (n = 4). *p < 0.01; two-way ANOVA (vs. control, −440, −611 and −803). (C) Primary chondrocytes infected with control (Cont) or Gli2 adenovirus were cultured for 3 d. Total RNA of the cells was determined by real-time PCR analysis for PTHrP. Data represent mean ± SD (n = 3). *p < 0.01 vs. control; Student's t test. (D) Cos7 (left) or ATDC5 cells (right) were transfected with a PTHrP gene promoter luciferase (1120 bp) and TK-renilla luciferase constructs with empty vector (Cont), Gli2, or Sox5/6/9 as indicated. After 48 h, luciferase activity of the cell lysates was measured. Transfection efficiency was normalized by renilla luciferase activity. Data represent mean ± SD (n = 3). *p < 0.01; one-way ANOVA (vs. control, Sox5/6/9, or Gli2). (E) Primary chondrocytes infected with control (Cont), HA-Sox9, or dominant-negative (DN)-Gli2 adenoviruses as indicated were cultured for 3 d. Total RNA of the cells was determined by real-time PCR analysis for PTHrP. Data represent mean ± SD (n = 3). *p < 0.01 vs. Sox9; one-way ANOVA. (F) Lysates of 293FT cells transfected with or without Myc-Gli2 were precipitated by TALON beads with His-tagged Sox9 or Venus protein, and then the precipitates were determined by immunoblotting with anti-Myc antibody (top). Inputs of Myc-Gli2 (middle) and His-tagged Sox9 protein (bottom) were determined by immunoblotting with anti-Myc and Sox9 antibodies, respectively.

Similar articles

Cited by

References

    1. Akiyama H., Chaboissier M. C., Martin J. F., Schedl A., de Crombrugghe B. The transcription factor Sox9 has essential roles in successive steps of the chondrocyte differentiation pathway and is required for expression of Sox5 and Sox6. Genes Dev. 2002;16:2813–2828. - PMC - PubMed
    1. Akiyama H., et al. Interactions between Sox9 and beta-catenin control chondrocyte differentiation. Genes Dev. 2004;18:1072–1087. - PMC - PubMed
    1. Akiyama H., Stadler H. S., Martin J. F., Ishii T. M., Beachy P. A., Nakamura T., de Crombrugghe B. Misexpression of Sox9 in mouse limb bud mesenchyme induces polydactyly and rescues hypodactyly mice. Matrix Biol. 2007;26:224–233. - PubMed
    1. Akiyama H. Control of chondrogenesis by the transcription factor Sox9. Mod. Rheumatol. 2008;18:213–219. - PubMed
    1. Amano K., Ichida F., Sugita A., Hata K., Wada M., Takigawa Y., Nakanishi M., Kogo M., Nishimura R., Yoneda T. MSX2 stimulates chondrocyte maturation by controlling Ihh expression. J. Biol. Chem. 2008;283:29513–29521. - PMC - PubMed

Publication types

MeSH terms

Substances