. 2009 Sep 16;29(37):11471-83.
doi: 10.1523/JNEUROSCI.1815-09.2009.

The convergence of information about rewarding and aversive stimuli in single neurons

Affiliations

The convergence of information about rewarding and aversive stimuli in single neurons

Sara E Morrison et al. J Neurosci. .

Abstract

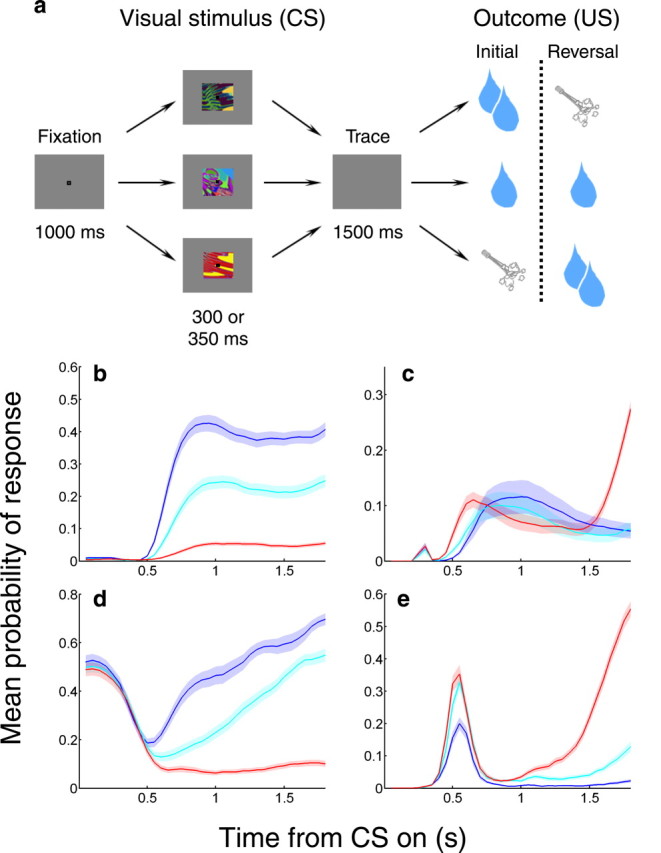
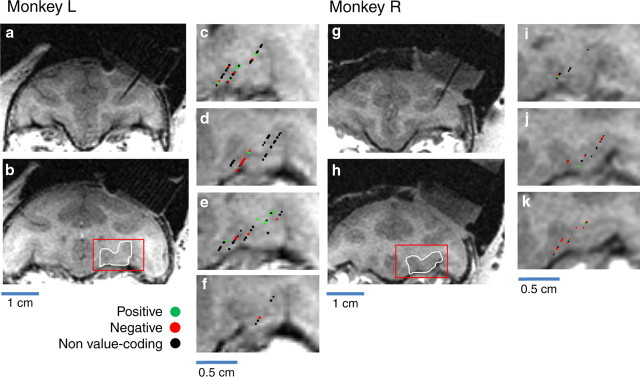
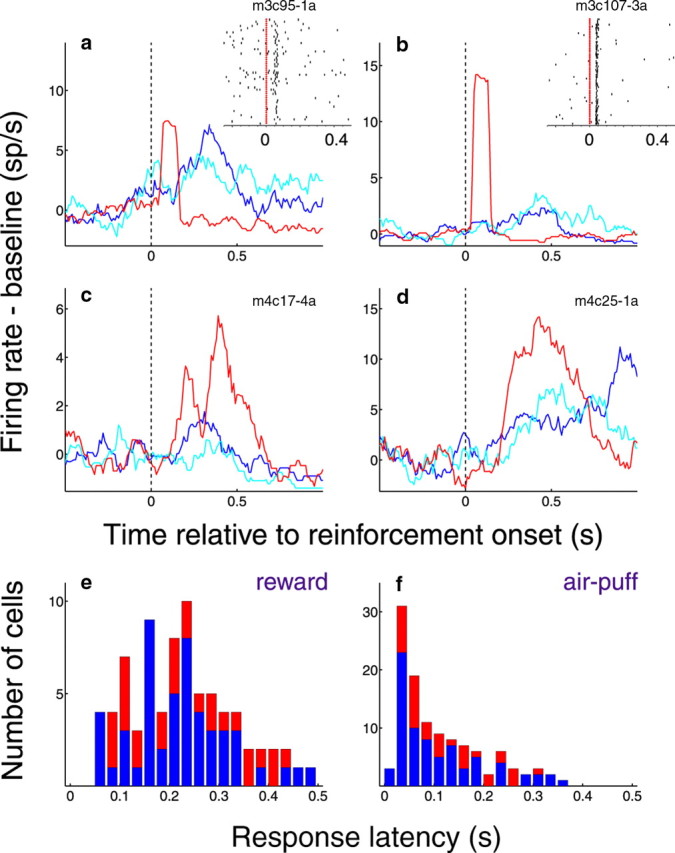
Neuroscientists, psychologists, clinicians, and economists have long been interested in how individuals weigh information about potential rewarding and aversive stimuli to make decisions and to regulate their emotions. However, we know relatively little about how appetitive and aversive systems interact in the brain, as most prior studies have investigated only one valence of reinforcement. Previous work has suggested that primate orbitofrontal cortex (OFC) represents information about the reward value of stimuli. We therefore investigated whether OFC also represents information about aversive stimuli, and, if so, whether individual neurons process information about both rewarding and aversive stimuli. Monkeys performed a trace conditioning task in which different novel abstract visual stimuli (conditioned stimuli, CSs) predicted the occurrence of one of three unconditioned stimuli (USs): a large liquid reward, a small liquid reward, or an aversive air-puff. Three lines of evidence suggest that information about rewarding and aversive stimuli converges in individual neurons in OFC. First, OFC neurons often responded to both rewarding and aversive USs, despite their different sensory features. Second, OFC neural responses to CSs often encoded information about both potential rewarding and aversive stimuli, even though these stimuli differed in both valence and sensory modality. Finally, OFC neural responses were correlated with monkeys' behavioral use of information about both rewarding and aversive CS-US associations. These data indicate that processing of appetitive and aversive stimuli converges at the single cell level in OFC, providing a possible substrate for executive and emotional processes that require using information from both appetitive and aversive systems.


Figures

Figure 1.
Figure 1.
Task and behavior. a, Trace conditioning task. Top and bottom rows, Images reverse associations with large rewards and air-puffs. Middle row, Image is always associated with small reward. b–e, Mean probability of licking (b, d) or blinking (c, e) for monkey L (b, c) and monkey R (d, e) as a function of time during the trial, averaged over all sessions for each subject. Blue, Probability of behavior during large reward trials; cyan, small reward trials; red, air-puff trials. Shaded areas, SEM.
Figure 2.
Figure 2.
OFC neurons and anticipatory licking differentiate among CSs. a, c, e, g, PSTHs for activity from four value-coding OFC neurons. PSTHs represent the average activity across trials. Blue, Average activity during large reward trials; cyan, average activity during small reward trials; red, average activity during air-puff trials. Vertical dotted lines indicate the time of image onset and offset. b, d, f, h, Mean probability of licking as a function of time during the trial, concurrent with recording of activity depicted in a, c, e, and g, respectively. Shading, SEM.
Figure 3.
Figure 3.
Magnetic resonance images and reconstruction of recording sites. a, Coronal MRI using a 2D inversion recovery (IR) sequence in monkey L, showing the artifact from an electrode inserted dorsal to OFC. This slice is slightly anterior to areas from which we recorded (e.g., 4 mm from the slice shown in b). b, Coronal MRI from monkey L highlighting a typical area from which we recorded. This slice is located ∼30 mm from the interaural plane. c–f, Magnified images of the OFC in four consecutive slices (1 mm apart) from the MRI shown in b (c being the farthest posterior, f the farthest anterior). Symbols indicate properties of cells found at recording sites (see key above). g, Coronal MRI using a 2D IR sequence in monkey R, showing the artifact from an electrode inserted dorsal to OFC. This slice is slightly anterior to areas from which we recorded (e.g., 3 mm from the slice shown in h). h, Coronal MRI from monkey R highlighting a typical area from which we recorded. This slice is located ∼28 mm from the interaural plane. i–k, Magnified images of the OFC in three consecutive slices (1 mm apart) from the MRI shown in h (i being the farthest posterior, k the farthest anterior). Symbols are as in c–f.
Figure 4.
Figure 4.
Population neural activity in OFC is not related to motor responses. a, b, Population lick-triggered PSTH for positive value-coding cells, centered on licks in the trace interval (a) or intertrial interval (b). Note that the response profiles for the two intervals do not resemble each other. c, d, Population lick-triggered PSTH for negative value-coding cells, centered on licks in the trace interval (c) or intertrial interval (d). Note that the response profiles in both intervals are similar to those for positive value-coding cells, suggesting that the relationship between spiking and licking does not explain the valence of encoding. e, f, Population blink-triggered PSTH for positive value-coding cells, centered on blinks in the trace interval (e) or US interval (f). Note that the response profiles for the two intervals do not resemble each other. g, h, Population blink-triggered PSTH for negative value-coding cells, centered on blinks in the trace interval (g) or US interval (h). Note that the response profiles in both intervals are similar to those for positive value-coding cells. The apparent peak in f and h may be related to air-puff, which often occurs just before blinks during this time interval.
Figure 5.
Figure 5.
OFC cells do not exhibit motor responses related to licking or blinking. We identified the onset of a change in neural activity (if present) during the 300 ms preceding a lick or blink. Licks were examined in two time intervals: the last 1 s of the trace interval and the last 1 s of the intertrial interval (ITI). Blinks were examined in two time intervals: the last 1 s of the trace interval, and the first 1 s of the US interval. a, b, Percentage of value-coding cells for which responses before licks (a) or blinks (b) are found in both intervals examined, one interval but not the other, or neither interval. c, d, We used a high-sensitivity version of the same analysis as in a, b to obtain a broader population of cells with candidate motor responses. For each cell that had an identified response in both intervals examined, we plotted the time of response onset in the trace interval against the time of response onset in the intertrial interval (licks, c) or US interval (blinks, d). Blue, Positive value-coding cells; red, negative value-coding cells.
Figure 6.
Figure 6.
Many positive and negative value-coding cells respond to both rewards and air-puffs. a–d, Peristimulus histograms of neural activity aligned on reward or air-puff onset. Activity is normalized by subtracting from the firing rate the average of the preceding 500 ms of trace interval activity, and smoothed with a 100 ms moving average. Vertical dashed line, Time of reinforcement onset. Blue line, Activity in response to large reward; cyan line, activity in response to small reward; red line, activity in response to air-puff. a, b, Positive value-coding cells with excitatory responses to rewards and air-puff. Insets, Raster plots centered on air-puff presentation (red ticks). Each row of dots represents action potentials on one trial. c, d, Negative value-coding cells with excitatory responses to rewards and air-puffs, except to small reward in c. e, f, Distribution of latencies to respond to reward (e) or air-puff (f) in all cells for which such responses were identified. Latencies were not significantly different among positive, negative, and non-value-coding cells (pairwise Wilcoxons, p > 0.05), and were therefore combined. Blue, Increases in firing; red, decreases in firing.
Figure 7.
Figure 7.
Single neurons in OFC have a variety of reinforcement response profiles. a, Summary of reinforcement responses in positive value-coding OFC cells. “Incr.,” “decr.,” “None” refer to cells' responses to air-puff. Blue, Cells with excitatory responses to large reward; red, inhibitory responses to large reward; black, no response to large reward. b, Summary of reinforcement responses in negative value-coding cells. “Incr.,” “decr.,” “none” refer to cells' responses to large reward. Blue, Cells with excitatory responses to air-puff. Red, Inhibitory responses to air-puff. Black, No response to air-puff. c, Summary of reinforcement responses in non-value-coding cells. “Incr.,” “decr.,” “none” refer to cells' responses to large reward. Blue, Cells with excitatory responses to air-puff; red, inhibitory responses to air-puff; black, no response to air-puff.
Figure 8.
Figure 8.
OFC neurons process information about rewarding and aversive stimuli. a, Positive/weak-positive discrimination index, comparing activity on small and large reward trials, plotted against weak-positive/negative discrimination index, comparing activity on small reward and air-puff trials, for each value-coding cell. Green symbols, Positive cells; red symbols, negative cells. See above for key to symbols. Data points are nonrandomly distributed (χ2 test, p < 0.0001) for each monkey. b, Weak-positive/negative discrimination indices for all positive value-coding neurons. c, Positive/weak-positive discrimination indices for all negative value-coding neurons. In b and c: blue, significant discrimination index (p < 0.05, permutation test); red, nonsignificant discrimination index. Arrowheads, Mean of each distribution. d, e, Population average PSTH for all positive (d) and negative (e) value-coding neurons. Blue line, Large reward trials; cyan line, small reward trials; red line, air-puff trials. Vertical dotted line indicates image onset.
Figure 9.
Figure 9.
A subpopulation of OFC neural responses anticipate air-puff delivery. Population PSTH for negative OFC cells that increase their firing in anticipation of air-puff delivery (“ramp-up” activity) (n = 10, 22% of negative cells). Note that these cells on average also respond to air-puff but not to “no reward,” and the cells demonstrate differential responses to CSs associated with small and large rewards (see Results).
Figure 10.
Figure 10.
Behavioral and neural responses to CSs reflect the incorporation of information about reward and aversive stimuli. a, Proportion of time spent licking (blue) or blinking (red) during the last 1.0 s of the trace interval on the first three trials of a daily session (left data points) and the last 20 trials of the initial learning block, before image value reversal (right data points). Error bars, SEM. Double asterisks, Significant difference between initial and subsequent trials (Wilcoxon, p < 0.001). b, Average normalized neural activity (Z-scores) on the first three trials of an experiment and the last 20 trials of the initial block. Error bars, SEM. Asterisk or double asterisk, significant difference between initial and subsequent trials (Wilcoxon, p < 0.05 or p < 0.001). Dagger, p = 0.09. c, d, Expectation indices for each neuron's preferred (c) and nonpreferred (d) trial type. Blue, Index significantly different from 0.5 (p < 0.05). Red, Index not significantly different from 0.5. Arrowhead indicates mean. e, f, Average neural activity as a function of time during the trial. Vertical dotted line indicates time of image onset.

References

    1. Apicella P, Ljungberg T, Scarnati E, Schultz W. Responses to reward in monkey dorsal and ventral striatum. Exp Brain Res. 1991;85:491–500. - PubMed
    1. Barbas H. Specialized elements of orbitofrontal cortex in primates. Ann N Y Acad Sci. 2007;1121:10–32. - PubMed
    1. Baxter MG, Parker A, Lindner CC, Izquierdo AD, Murray EA. Control of response selection by reinforcer value requires interaction of amygdala and orbital prefrontal cortex. J Neurosci. 2000;20:4311–4319. - PMC - PubMed
    1. Belova MA, Paton JJ, Morrison SE, Salzman CD. Expectation modulates neural responses to pleasant and aversive stimuli in primate amygdala. Neuron. 2007;55:970–984. - PMC - PubMed
    1. Belova MA, Paton JJ, Salzman CD. Moment-to-moment tracking of state value in the amygdala. J Neurosci. 2008;28:10023–10030. - PMC - PubMed

Publication types

MeSH terms

LinkOut - more resources