. 2009 Oct;119(10):2965-75.
doi: 10.1172/JCI38994. Epub 2009 Sep 14.

The inability to disrupt the immunological synapse between infected human T cells and APCs distinguishes HIV-1 from most other primate lentiviruses

Affiliations

The inability to disrupt the immunological synapse between infected human T cells and APCs distinguishes HIV-1 from most other primate lentiviruses

Nathalie Arhel et al. J Clin Invest. 2009 Oct.

Abstract

Viruses that infect T cells, including those of the lentivirus genus, such as HIV-1, modulate the responsiveness of infected T cells to stimulation by interacting APCs in a manner that renders the T cells more permissive for viral replication. HIV-1 and other primate lentiviruses use their Nef proteins to manipulate the T cell/APC contact zone, the immunological synapse (IS). It is known that primate lentiviral Nef proteins differ substantially in their ability to modulate cell surface expression of the TCR-CD3 and CD28 receptors critical for the formation and function of the IS. However, the impact of these differences in Nef function on the interaction and communication between virally infected T cells and primary APCs has not been investigated. Here we have used primary human cells to show that Nef proteins encoded by HIV-2 and most SIVs, which downmodulate cell surface expression of TCR-CD3, disrupt formation of the IS between infected T cells and Ag-presenting macrophages or DCs. In contrast, nef alleles from HIV-1 and its simian precursor SIVcpz failed to suppress synapse formation and events downstream of TCR signaling. Our data suggest that most primate lentiviruses disrupt communication between virally infected CD4+ Th cells and APCs, whereas HIV-1 and its SIV precursor have largely lost this capability. The resulting differences in the levels of T cell activation and apoptosis may play a role in the pathogenesis of AIDS.


Figures

Figure 1
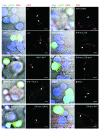
Figure 1. Nef alleles that downmodulate TCR-CD3 impair the ability of virally infected primary T cells to form complexes with APCs.
(A and B) PBLs were infected with NL4-3–IRES–eGFP viruses encoding different Nefs, and complex formation with autologous SEE-pulsed DCs and MDMs was assessed 4 days after infection by fluorescence microscopy (A) and flow cytometry (B). (A) Representative acquisition frames of cocultures between infected PBLs and MDMs or DCs, with phase-contrast (Nomarski), eGFP, and PKH26 superimposed. Scale bars: 10 μm. The proportion of infected (eGFP+) cells contacting labeled autologous MDMs or DCs was scored randomly by single-blind method with n = 60 per sample per experiment. Results are mean ± SD of 4–5 independent experiments. In all experiments, 25%–55% of PBLs infected with the nef-defective control HIV-1 construct (nef–) formed complexes with autologous APCs; nef– values are set as 100%. (B) Representative flow cytometry acquisitions for complex formation between infected PBLs and MDMs or DCs. Percentages denote the number of eGFP+ cells in the DC gating that are PKH26+ (as a percentage of all eGFP+ cells). Graphs show mean ± SD of 3 and 4 experiments in DCs and MDMs, respectively. In all experiments, 3%–13% of PBLs infected with nef– formed complexes with autologous APCs; nef– values are set as 100%. Red and green bars denote nef alleles of group 1 and group 2, respectively. Combined results for group 1 (G1) and group 2 (G2) Nefs represent average values ± SD. *P < 0.05; #P < 0.01; §P < 0.001.
Figure 2
Figure 2. Effect of primate lentiviral Nefs on TCR-CD3 cell surface expression and clustering at the IS.
Primary CD4+ T cells were not infected (n.i.) or were infected with HIV-1 constructs expressing the indicated nef alleles. At 3 days after infection, the T cells were incubated with autologous sAg-pulsed DCs, fixed, and stained with anti-CD3. Images show representative confocal acquisitions from cocultures between infected CD4+ T cells and autologous sAg-pulsed DCs labeled with DAPI. Shown are CD3 Ab labeling alone and merged images of eGFP, DAPI, and CD3. Arrowheads point to zones of close contact between infected T cells and DCs. Close contact was rarely observed in T cell/APC cultures infected with viral constructs expressing group 1 Nefs, and these cells did not express CD3 at their surface. Scale bars: 5 μm.
Figure 3
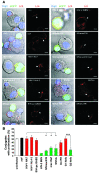
Figure 3. Nef-mediated downmodulation of TCR-CD3 prevents Lck polarization at the IS.
(A) CD4+ T cells infected with HIV-1 constructs expressing the indicated nef alleles were incubated with autologous sAg-pulsed DCs, fixed, and stained with anti-Lck. Images show representative confocal acquisitions from cocultures between infected CD4+ T cells and autologous sAg-pulsed DCs labeled with DAPI. Shown are Lck Ab labeling alone and merged images of eGFP, DAPI, and Lck. Arrowheads point to zones of close contact between infected T cells and DCs. Scale bars: 5 μm. (B) Number of HIV-1–infected eGFP+ T cells engaged in complex formation with APCs, showing accumulation of Lck at the IS. Results are mean ± SD of 2 independent experiments. *P < 0.05; ***P < 0.001.
Figure 4
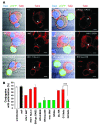
Figure 4. Nef alleles that downmodulate CD3 inhibit talin clustering at the IS.
(A) CD4+ T cells infected with HIV-1 constructs expressing the indicated nef alleles were incubated with autologous sAg-pulsed DCs, fixed, and stained with anti-talin. Images show representative confocal acquisitions from cocultures between infected CD4+ T cells and autologous sAg-pulsed DCs labeled with DAPI. Shown are talin Ab labeling alone and merged images of eGFP, DAPI, and talin. Arrowheads point to zones of close contact between infected T cells and DCs. Scale bars: 5 μm. (B) Number of HIV-1–infected eGFP+ T cells engaged in complex formation with APCs, showing polarization of talin at the zone of contact. Results are mean ± SD of 2 independent experiments (except for NA7, tNef, and SIVblu Nefs, which were derived from a single experiment). ***P < 0.001.
Figure 5
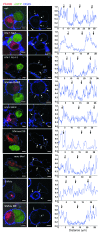
Figure 5. Nef alleles that downmodulate TCR-CD3 impair CD43 exclusion at the IS.
Images show representative confocal acquisitions from cocultures between infected PBLs and autologous SEE-pulsed DCs. Shown are CD43 Ab labeling alone and merged images of eGFP, PKH26, and CD43. Scale bars: 5 μm. Close contact was rarely observed in PBL/APC cultures infected with viral constructs expressing HIV-2 BEN or SIVblu Nefs, and occasional cell-cell complexes did not show CD43 exclusion, as determined by microscopic examination and analysis of the CD43 signal intensity along the plane of the cell-cell interface. The x axis represents distance along the contact zone; the y axis denotes pixel intensity. The location of 3–4 representative points per construct, and their corresponding intensities, are shown by the numbered arrowheads.
Figure 6
Figure 6. Downmodulation of IS formation perturbs early TCR-CD3 signaling events after coculture with APCs.
PBLs were allowed to return to a less-activated state after infection by removal of all cytokines in the growth medium for 3 days. PBLs were stimulated with CD3/CD28 beads for the indicated times or left unstimulated, and then labeled for intracellular phospho–ZAP-70 kinase. (A) Percentage of pZAP-70+ infected cells, shown as mean ± SD of 3 independent experiments. In all experiments, 5%–20% of PBLs infected with nef– were pZAP-70+ after 15 minutes’ stimulation with CD3/CD28 beads; nef– values are set as 100%. *P < 0.05; ***P < 0.001. (B) Kinetic of ZAP-70 phosphorylation in PBL cultures infected with HIV-1 constructs expressing the indicated nef alleles. Values represent percent ZAP-70+ cells and are representative of 2 independent experiments performed.
Figure 7
Figure 7. TCR-CD3 downmodulation leads to decreased IL-2 production after dynamic synapse interaction with primary APCs.
Infected PBLs were cocultured with autologous SEE-pulsed DCs or MDMs for 16 hours and then labeled for intracellular IL-2. Shown is the percentage of IL-2+ cells in the infected PBL population; results are mean ± SD of 3 independent experiments. In all experiments, 2%–7% of PBLs infected with nef– stained positive for intracellular IL-2; nef– values are set as 100%. *P < 0.05; ***P < 0.001.

References

    1. Monks C.R., Freiberg B.A., Kupfer H., Sciaky N., Kupfer A. Three-dimensional segregation of supramolecular activation clusters in T cells. Nature. 1998;395:82–86. doi: 10.1038/25764. - DOI - PubMed
    1. Grakoui A., et al. The immunological synapse: a molecular machine controlling T cell activation. Science. 1999;285:221–227. doi: 10.1126/science.285.5425.221. - DOI - PubMed
    1. Dustin M.L. A dynamic view of the immunological synapse. Semin. Immunol. 2005;17:400–410. doi: 10.1016/j.smim.2005.09.002. - DOI - PubMed
    1. Krummel M.F., Davis M.M.2002. .D ynamics of the immunological synapse: finding, establishing and solidifying a connection. Curr. Opin. Immunol. 1466–74.10.1016/S0952-7915(01)00299-0 - DOI - PubMed
    1. Krummel M.F., Sjaastad M.D., Wulfing C., Davis M.M. Differential clustering of CD4 and CD3ζ during T cell recognition. Science. 2000;289:1349–1352. doi: 10.1126/science.289.5483.1349. - DOI - PubMed

Publication types

MeSH terms

Substances