. 2009 Sep 14;4(9):e7002.
doi: 10.1371/journal.pone.0007002.

Design parameters to control synthetic gene expression in Escherichia coli

Affiliations

Design parameters to control synthetic gene expression in Escherichia coli

Mark Welch et al. PLoS One. .

Abstract

Background: Production of proteins as therapeutic agents, research reagents and molecular tools frequently depends on expression in heterologous hosts. Synthetic genes are increasingly used for protein production because sequence information is easier to obtain than the corresponding physical DNA. Protein-coding sequences are commonly re-designed to enhance expression, but there are no experimentally supported design principles.

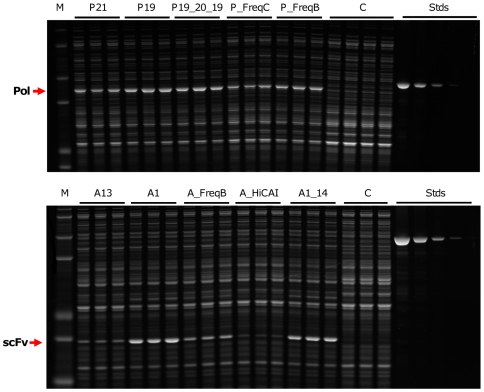
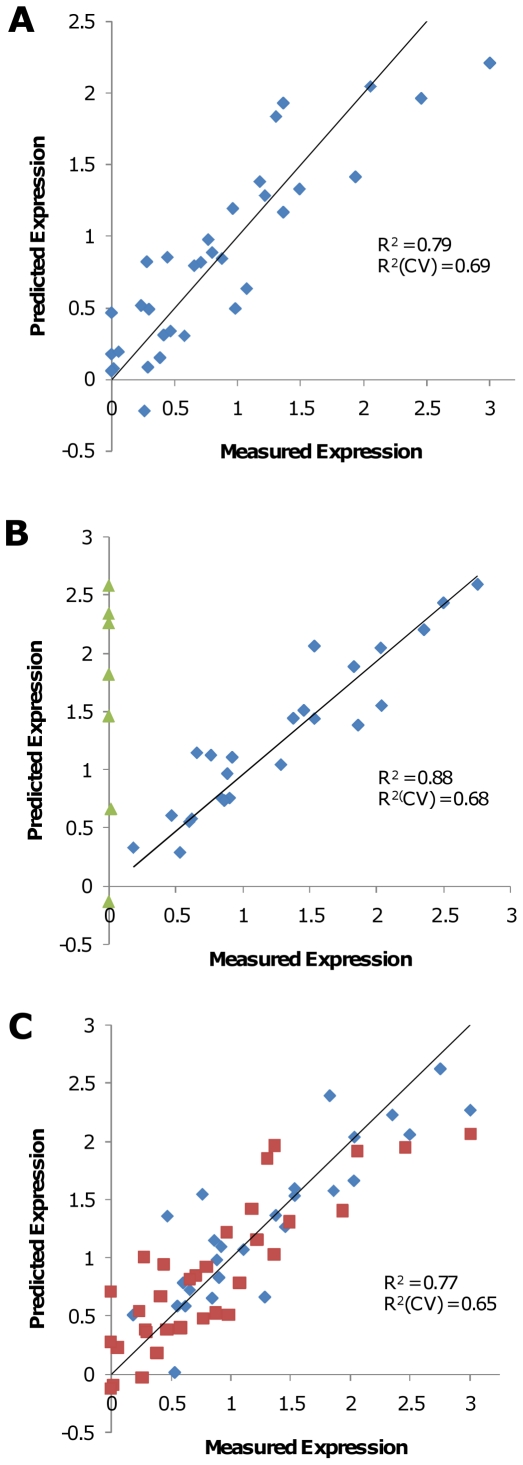
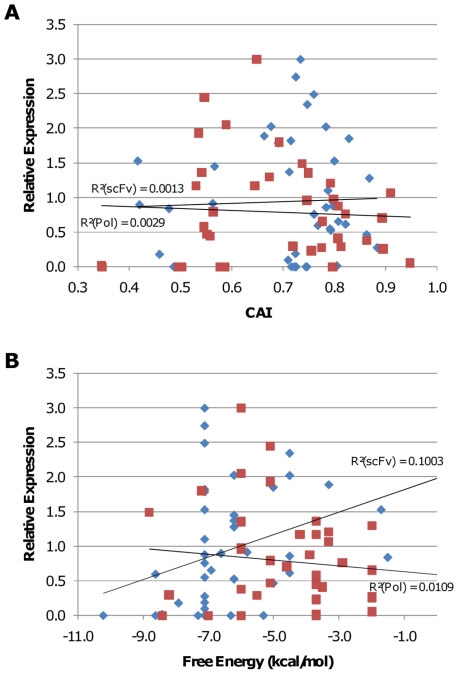
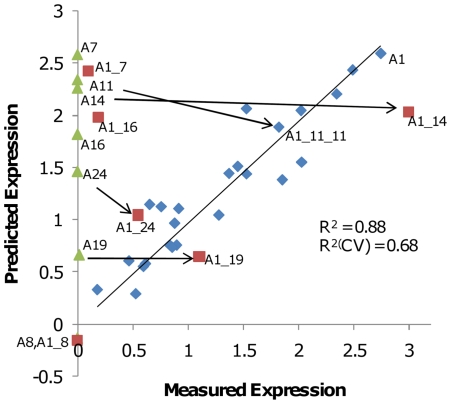
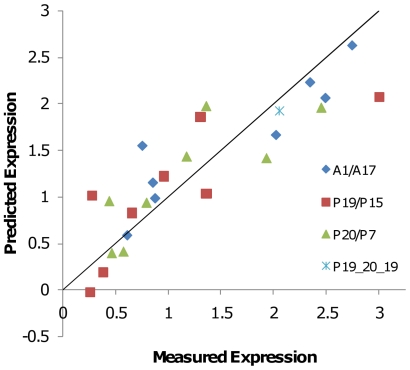
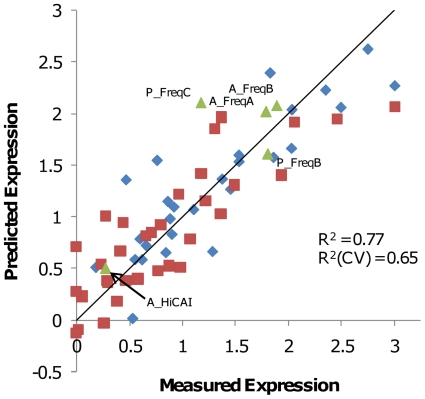
Principal findings: To identify sequence features that affect protein expression we synthesized and expressed in E. coli two sets of 40 genes encoding two commercially valuable proteins, a DNA polymerase and a single chain antibody. Genes differing only in synonymous codon usage expressed protein at levels ranging from undetectable to 30% of cellular protein. Using partial least squares regression we tested the correlation of protein production levels with parameters that have been reported to affect expression. We found that the amount of protein produced in E. coli was strongly dependent on the codons used to encode a subset of amino acids. Favorable codons were predominantly those read by tRNAs that are most highly charged during amino acid starvation, not codons that are most abundant in highly expressed E. coli proteins. Finally we confirmed the validity of our models by designing, synthesizing and testing new genes using codon biases predicted to perform well.

Conclusion: The systematic analysis of gene design parameters shown in this study has allowed us to identify codon usage within a gene as a critical determinant of achievable protein expression levels in E. coli. We propose a biochemical basis for this, as well as design algorithms to ensure high protein production from synthetic genes. Replication of this methodology should allow similar design algorithms to be empirically derived for any expression system.


Conflict of interest statement

Competing Interests: The authors declare competing financial interests: DNA2.0 performs gene design optimization as a free service with the genes that it sells. The authors also declare competing interests in the form of two pending relevant US patent applications, nos. 12/184,240 and 12/184,234. Austin Gurney declares no competing interests.

Figures

Figure 1
Figure 1. Protein expression from variant genes.
Equal amounts of bacterial lysates were separated by polyacrylamide gel electrophoresis and stained with Sypro Ruby (Pierce). Three independent clones for each variant were measured. Variant names are indicated above the gel lanes. Also shown are molecular weight standards (M); negative control samples (C); BSA mass standards (Stds). Red arrows indicate positions of full-length phi29 DNA polymerase (top panel) or scFv (bottom panel). BSA standard lanes include 500, 250, 125, 62.5, and 25 ng total protein (top panel, left to right) or 1000, 500, 250, 125, and 50 ng total protein (bottom panel, left to right).
Figure 2
Figure 2. PLS codon frequency models.
For each variant the measured expression level was plotted against the expression predicted from a PLS model using genetic algorithm-selected codons. (A) Model fit for polymerase variant expression data. Blue diamonds indicate the 34 gene training set used to create the model. (B) Model fit for scFv expression data. Blue diamonds indicate the 24 gene training set used to create the model. Green triangles are variants from the initial set with undetectable expression, and which were not used for model building. (C) Combined model constructed from polymerase variants (34 red squares) and scFv variants (27 blue diamonds). Expression in each set was normalized to the highest expression level in that set ( = 3). R2(CV) indicates the correlation coefficient for the fit of the model in cross-validation (see Materials and Methods). Variants used to provide datapoints for construction of the models are indicated in Table S1.
Figure 3
Figure 3. Expression is not predicted by Codon Adaptation Index or mRNA structure.
The codon adaptation index (part A) and the strength of mRNA secondary structure from position −4 to +38 relative to the initiating AUG (part B) were calculated for each variant synthesized in this study and plotted against the expression level measured for that variant. Blue diamonds indicate scFv variants. Red squares indicate polymerase variants. Expression levels are normalized to highest expressing variant for each set (equal to 3).
Figure 4
Figure 4. Modification of 5′ sequence improves the performance of some scFv variants.
For each scFv variant the measured expression level was plotted against the expression predicted from a PLS model using genetic algorithm-selected codons. Blue diamonds indicate the 24 gene training set used to create the model, Green triangles are variants from the initial set with undetectable expression. Red squares are new variants created by combining the first segment (the first 15 codons) of variant A1 with the remainder of these 6 poorly-expressed variants. Arrows indicate changes in predicted and measured expression upon 5′ codon exchange. Variants represented as green triangles or red squares were not included in the training set from which the model was built. Variant A1_11_11, in which a larger 43 codon portion of the 5′ section of the A11 gene was replaced with that of A1, is also indicated for comparison.
Figure 5
Figure 5. Prediction of variant chimera expression by the combined dataset PLS model.
Expression predicted by the combined model shown in Figure 2C for the subset of chimeric variants. Each chimera series is indicated by different symbols as shown in the legend.
Figure 6
Figure 6. New gene variants express as predicted by the combined PLS model.
For each variant the measured expression level was plotted against the expression predicted from a PLS model using genetic algorithm-selected codons. Polymerase variants (34 red squares) and scFv variants (27 blue diamonds) were included in the training set, expression in each set was normalized to the highest expression level in that set ( = 3). Green triangles show measured and predicted expression of 5 new genes not included in the training set. Correlation coefficients represent fits of the entire training set.

References

    1. Venter JC, Remington K, Heidelberg JF, Halpern AL, Rusch D, et al. Environmental genome shotgun sequencing of the Sargasso Sea. Science. 2004;304:66–74. - PubMed
    1. Newcomb J, Carlson R, Aldrich SC. Cambridge, MA: Bio Economic Research Associates; 2007. Genome synthesis and design futures: Implications for the U.S. economy.
    1. Welch M, Villalobos A, Gustafsson C, Minshull J. You're one in a googol: optimizing genes for protein expression. J R Soc Interface. 2009;6:S467–S476. - PMC - PubMed
    1. Itakura K, Hirose T, Crea R, Riggs AD, Heyneker HL, et al. Expression in Escherichia coli of a chemically synthesized gene for the hormone somatostatin. Science. 1977;198:1056–1063. - PubMed
    1. Henaut A, Danchin A. Analysis and predictions from Escherichia coli sequences. In: Neidhardt FC, Curtiss RI, Ingraham J, Lin E, Brooks Low K, et al., editors. Escherichia coli and Salmonella typhimurium cellular and molecular biology. Washington, D.C: ASM press; 1996. pp. 2047–2066.

Publication types