. 2009 Nov;10(11):1669-84.
doi: 10.1111/j.1600-0854.2009.00974.x. Epub 2009 Aug 5.

Selective targeting of ER exit sites supports axon development

Affiliations

Selective targeting of ER exit sites supports axon development

Meir Aridor et al. Traffic. 2009 Nov.

Abstract

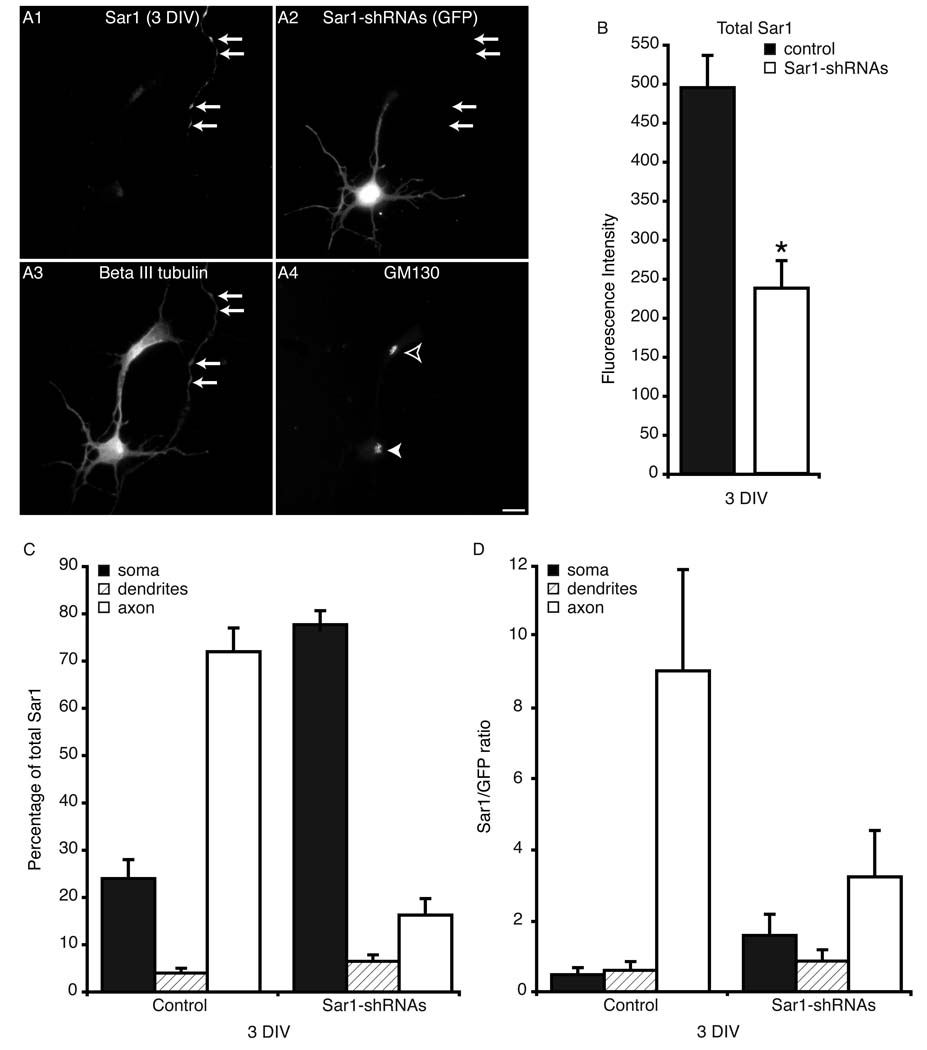
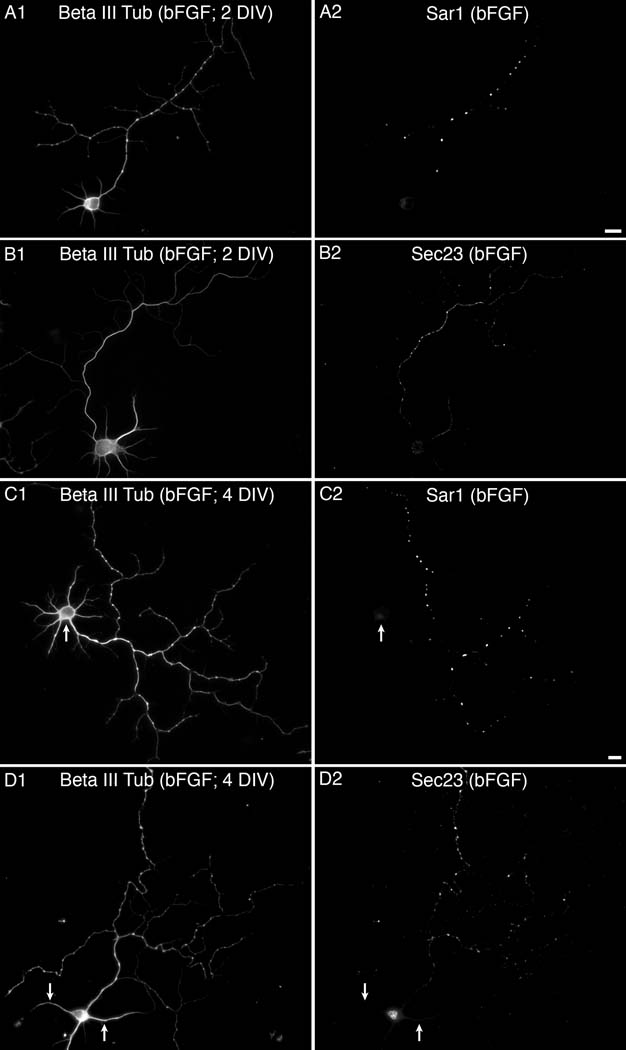
During neuron development, the biosynthetic needs of the axon initially outweigh those of dendrites. However, although a localized role for the early secretory pathway in dendrite development has been observed, such a role in axon growth remains undefined. We therefore studied the localization of Sar1, a small GTPase that controls ER export, during early stages of neuronal development that are characterized by selective and robust axon growth. At these early stages, Sar1 was selectively targeted to the axon where it gradually concentrated within varicosities in which additional proteins that function in the early secretory pathway were detected. Sar1 targeting to the axon followed axon specification and was dependent on localized actin instability. Changes in Sar1 expression levels at these early development stages modulated axon growth. Specifically, reduced expression of Sar1, which was initially only detectable in the axon, correlated with reduced axon growth, where as overexpression of Sar1 supported the growth of longer axons. In support of the former finding, expression of dominant negative Sar1 inhibited axon growth. Thus, as observed in lower organisms, mammalian cells use temporal and spatial regulation of endoplasmic reticulum exit site (ERES) to address developmental biosynthetic demands. Furthermore, axons, such as dendrites, rely on ERES targeting and assembly for growth.


Figures

Figure 1
Figure 1. Sar1 marks the axon during early stages of neuronal development
Rat hippocampal neurons were fixed at indicated times post plating and labeled with phalloidin (A1, B1, and C1; red in A3, B3, and C3) and antibodies to Sar1 (A2, B2, and C2; green in A3, B3, and C3). Sar1 distribution in stage 2 neurons (6 hrs in vitro) is shown in panel A. By 12 hours in vitro Sar1 is targeted to a single elongated neurite (B). By stage 3 of development, Sar1 is heavily concentrated into the differentially extended neurite (C–24 hours in vitro). Bars equal 10 µm.
Figure 2
Figure 2. Sar1 distribution in 2 and 3 DIV neurons
Rat (A & C) and mouse (B) hippocampal neurons were fixed at indicated times post plating. (A–B) Cultures were labeled with phalloidin (A1 and B1; red in A3 and B3) and antibodies to Sar1 (A2 and B2; green in A3 and B3). (C) Cultures were transfected with GFP (C2; green in C4) prior to plating and labeled with antibodies to Sar1 (C1; red in C4) and Map2 (C3; green in C4). Beginning at 3 DIV axonal Sar1 starts to associate with varicosities (arrows in C). C1-4 were made using two fields stitched together. Bars equal 10 µm.
Figure 3
Figure 3. Sar1 distribution in mature neurons
Rat primary hippocampal neurons were fixed at indicated times post plating. Neurons in A (8 DIV) and C (14 DIV) were stained for MAP2 (A1 and C1; red in A3 and C3) and Sar1 (A2 and C2; green in A3 and C3), the one in B (12 DIV) was stained for Tau (B1; red in B3) and Sar1 (B2; green in B3). Note the incoming axons in A and B (arrows) from neighboring neurons that are heavily labeled for Sar1. Also, note that in C Sar1 expression in the dendrites and the apical region of the axon (arrow) is similar. Bars equal 10 µm.
Figure 4
Figure 4. Sar1 facilitates axonal elongation
(A1–A4) Primary rat hippocampal neurons were transfected with GFP (A1), GFP and Flag-tagged hamster Sar1a (Sar1-wt-Flag; A2), GFP and Sar1-GDP-Flag (A3), or constructs that expressed GFP and the Sar1-shRNAs prior to plating and fixed at 2 DIV. (B–E) The effect of Sar1 levels on axonal elongation was determined at 2 and 3 DIV. For these experiments the effect of the different transfection conditions in A1–A4 on axon growth were determined by analyzing GFP expressing cells. As an additional control some of the cultures transfected with the Sar1-shRNAs were also transfected with Sar1-wt-Flag, which appears to be resistant to the Sar1-shRNAs (see Supplemental Fig. 1). Values equal mean ± SEM. An asterisk designates a significant difference between the condition and control GFP expressing neurons. See the main text for statistical significance. A2 is made of two images stitched together. The fields were overlapping, but skewed to one another resulting in a non-overlapping area in the upper left corner. For the purpose of presentation the area, which is outlined in white, was filled in with black. The bar in A4 is also for A1–A2; bars equal 10 µm.
Figure 5
Figure 5. Quantitative analysis of Sar1 levels in 3 DIV neurons
(A) Primary rat hippocampal neurons were transfected with Sar1-shRNAs prior to plating and labeled with antibodies to Sar1, beta III tubulin, and GM130 at 3 DIV. (B–C) Sar1 levels in neurons transfected with GFP (control) or Sar1-shRNAs were quantified by immunofluorescence microscopy. Values equal mean ± SEM. The asterisk in B designates a significant difference between the two conditions. (B–D) See main text for statistical analysis of the data. The arrows in A1 point to Sar1 staining in an axon coming from a neuron that is outside the field of view. The arrows in A2 & A3 point to the same region as those in A1. The filled arrowhead in A4 points to the Golgi of the neuron in the field that has been transfected with the Sar1-shRNAs constructs, while the open arrowhead points to that of an untransfected neighboring cell. The bar equals 10 µm.
Figure 6
Figure 6. Redistribution of endogenous Sar1 after cytochalasin D induced actin destabilization
(A–B) Rat hippocampal neurons were treated with DMSO only or CytD for 24 hours starting at 4 hours post plating. At 28 hours post plating cultures were fixed and labeled with phalloidin (A1 & B1) and antibodies to Sar1 (A2 & B2). (C–F) Neurons (1 DIV) were rinsed with PBS, permeabilized, and washed as described in Methods. Cells were then incubated in the presence of buffer (C), 5 µg Sar1-GTP (D), 5 µg Sar1-GTP and rat liver cytosol (E), or 5 µg Sar1-GDP and rat liver cytosol (F). At the end of the incubations, the distribution of Sar1 (C–D) and Sec13 (E–F) was determined using IF microscopy. Open arrowhead in D points to ERES in a minor neurite. The bar in F is also for C–E; bars equal 10 µm.
Figure 7
Figure 7. Distribution of the secretory pathway during neuronal development
Rat primary hippocampal neurons were fixed at 1 (A–J) and 4 (K) DIV. Cultures were immunostained for proteins of the secretory pathway as indicated in the figure. In A–J the longest neurite is oriented such that it extends away from the soma in the direction the arrow is pointing in A. (K) 4 DIV neurons were labeled with phalloidin (K1) and antibodies to Sec23 (K2). Bars equal 10 µm.
Figure 8
Figure 8. Exogenously expressed ERES markers are targeted to axons
(A–C) Localization of endogenous and over-expressed Yip1a, a membrane ERES marker, in the developing axon. (A) Untransfected early stage 3 neurons were stained using phalloidin (A1; red in A3) and an antibody directed against Yip1a (A2; green in A3). (B) Neuronal cultures transfected with a GFP-Yip1a (B2; green in B3) construct on 2 DIV, were fixed and stained with phalloidin (B1; red in B3) at 3 DIV. (C) Neuron cultures were transfected at 2 DIV with Myc-Yip1, fixed at 3 DIV, and stained for over-expressed Myc-Yip1 (C1; red in C3) and Sec23 (C2; green in C3) or Sar1 (c2a; green in c3a). The inset image c3b mag. is a blowup of the designated region in C3 (c3b). (D) Shows a 2 DIV rat hippocampal neuron, which was transfected prior to plating, expressing the ER marker mEmerald-KDEL. Bars equal 10 µm.
Figure 9
Figure 9. An increase in demand leads to enhanced recruitment of Sec23 to the growing axon
bFGF (10 ng/ml) was added to the culture media of rat hippocampal neurons at 2 hours post plating (A–B) or 2 DIV (C–D). Cultures were subsequently fixed at 2 and 4 DIV, respectively, and the distribution of Sar1 (A & C) and Sec23 (B & D) was assessed by immunofluorescence. An antibody against Beta III tubulin was used to visualize neuronal morphology (A1–D1). The arrows point to the same region within corresponding images. The bar in A is also for B and the one in C is also for D. Bars equal 10 µm.

References

    1. Bannykh SI, Balch WE. Membrane dynamics at the endoplasmic reticulum-Golgi interface. J Cell Biol. 1997;138(1):1–4. - PMC - PubMed
    1. Mostov K, Su T, ter Beest M. Polarized epithelial membrane traffic: conservation and plasticity. Nat Cell Biol. 2003;5(4):287–293. - PubMed
    1. Wiest DL, Burkhardt JK, Hester S, Hortsch M, Meyer DI, Argon Y. Membrane biogenesis during B cell differentiation: most endoplasmic reticulum proteins are expressed coordinately. J Cell Biol. 1990;110(5):1501–1511. - PMC - PubMed
    1. Morsomme P, Prescianotto-Baschong C, Riezman H. The ER v-SNAREs are required for GPI-anchored protein sorting from other secretory proteins upon exit from the ER. J Cell Biol. 2003;162(3):403–412. - PMC - PubMed
    1. Herpers B, Rabouille C. mRNA localization and ER-based protein sorting mechanisms dictate the use of transitional endoplasmic reticulum-golgi units involved in gurken transport in Drosophila oocytes. Mol Biol Cell. 2004;15(12):5306–5317. - PMC - PubMed

Publication types

Substances

LinkOut - more resources