

Detecting purely epistatic multi-locus interactions by an omnibus permutation test on ensembles of two-locus analyses
- PMID: 19761607
- PMCID: PMC2759961
- DOI: 10.1186/1471-2105-10-294
Detecting purely epistatic multi-locus interactions by an omnibus permutation test on ensembles of two-locus analyses
Abstract
Background: Purely epistatic multi-locus interactions cannot generally be detected via single-locus analysis in case-control studies of complex diseases. Recently, many two-locus and multi-locus analysis techniques have been shown to be promising for the epistasis detection. However, exhaustive multi-locus analysis requires prohibitively large computational efforts when problems involve large-scale or genome-wide data. Furthermore, there is no explicit proof that a combination of multiple two-locus analyses can lead to the correct identification of multi-locus interactions.
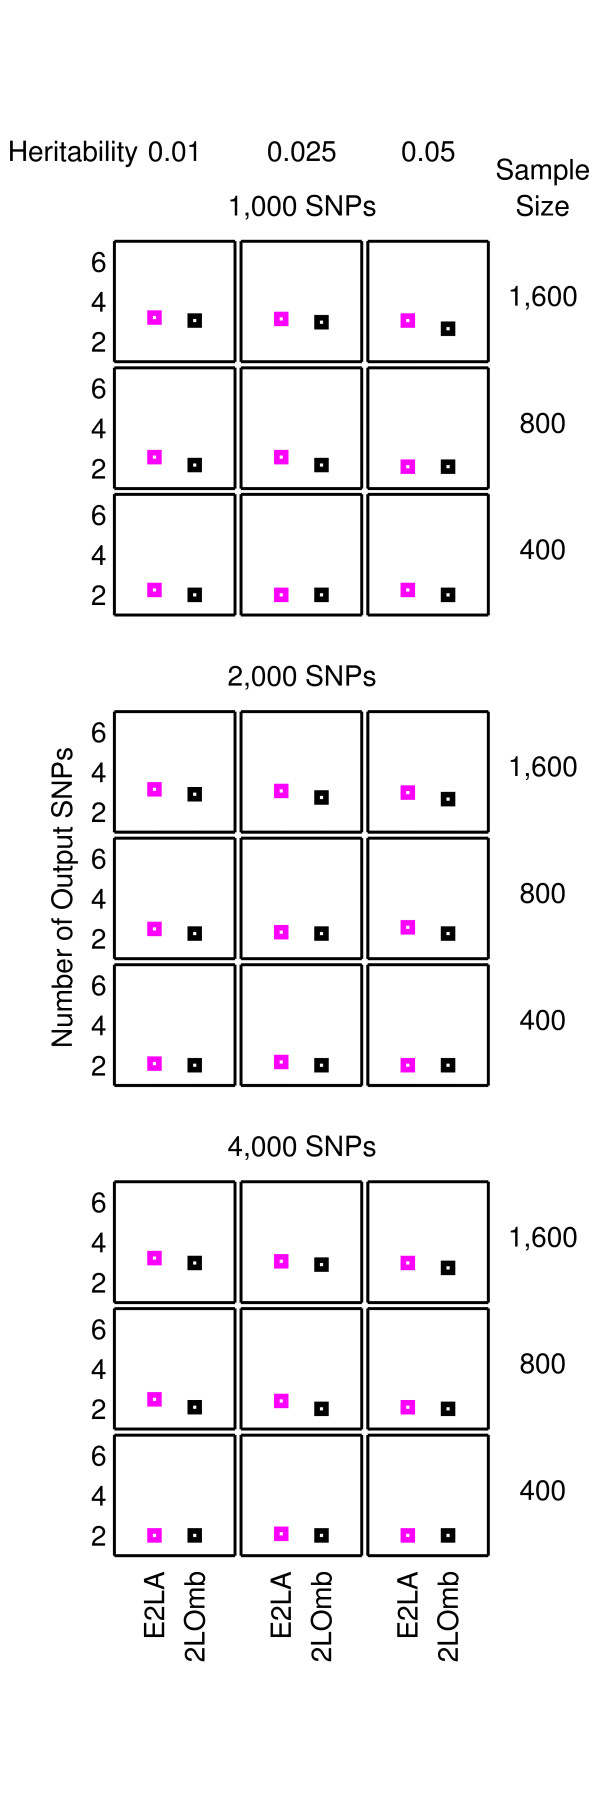
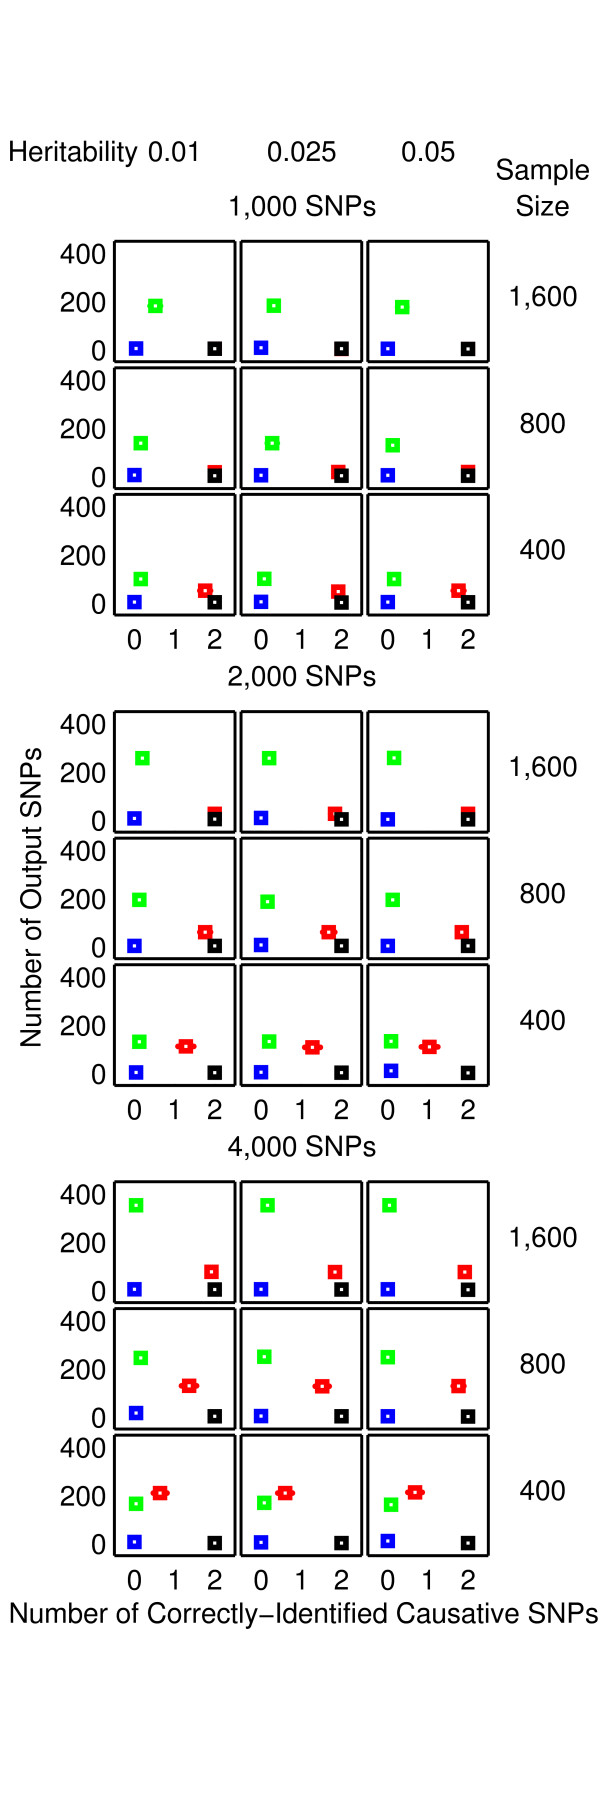
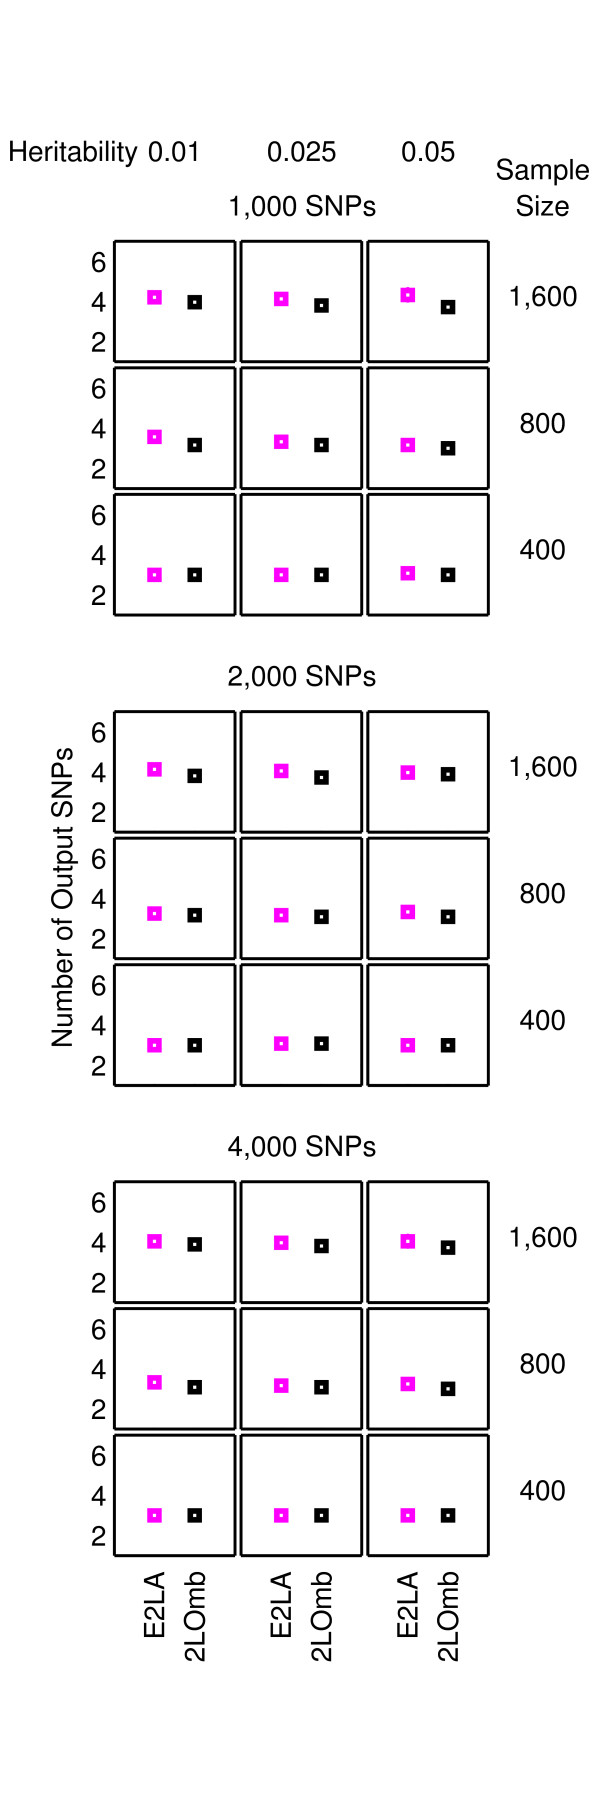
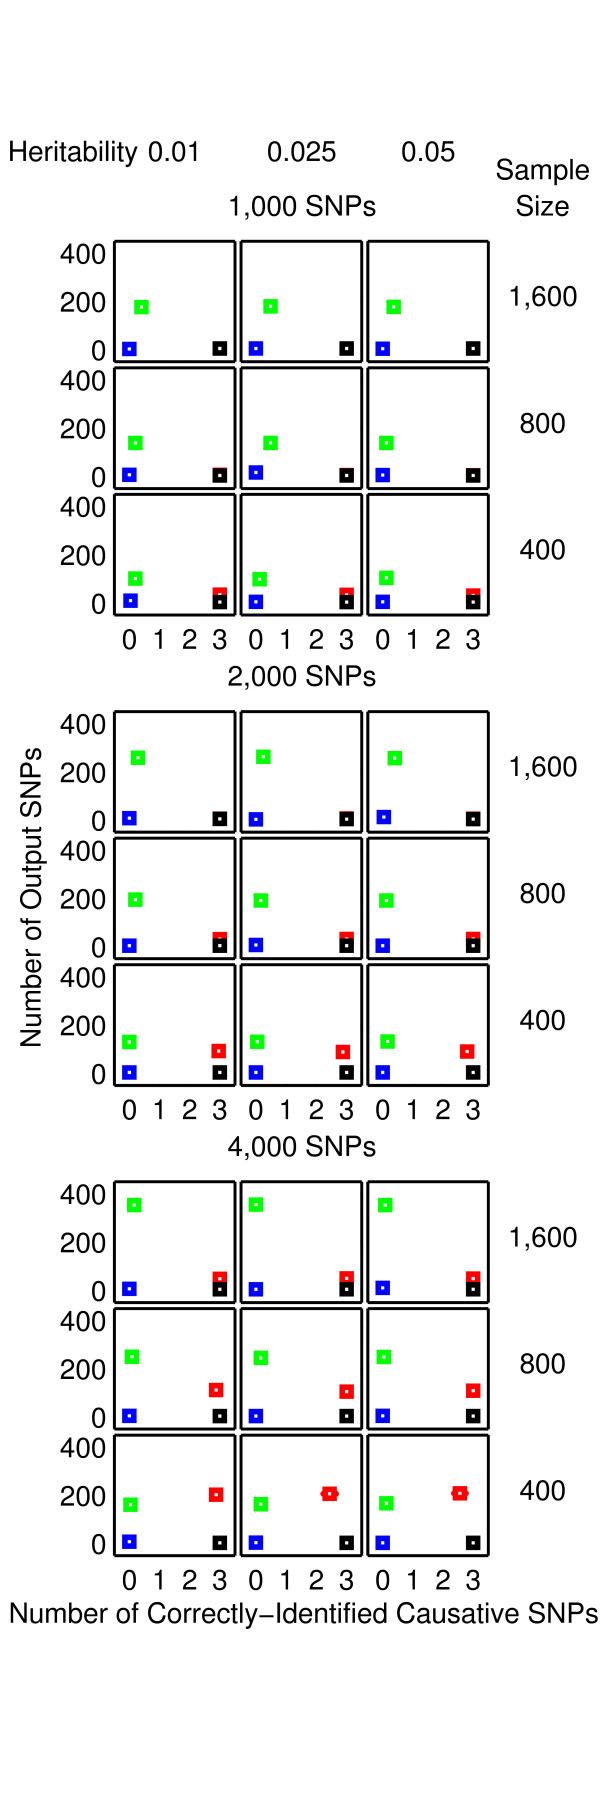
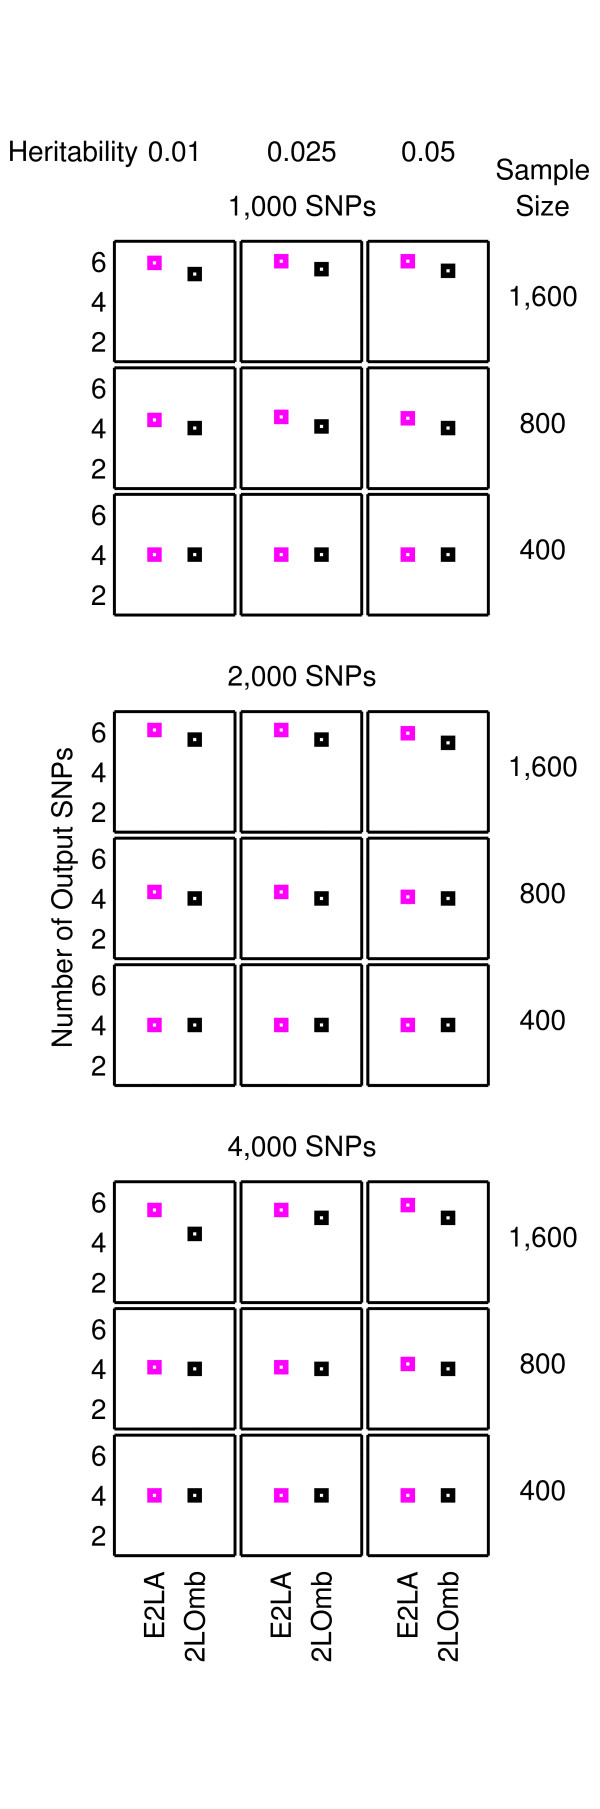
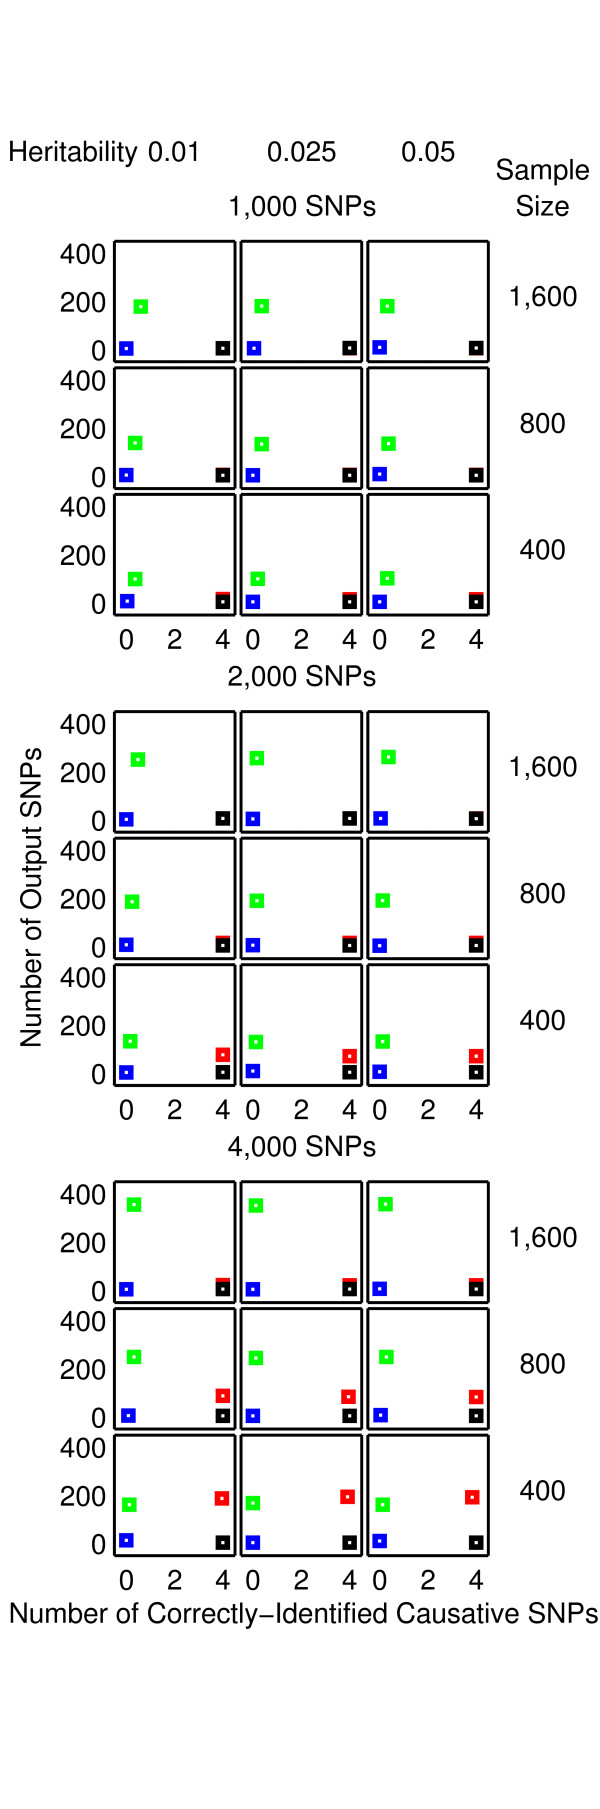
Results: The proposed 2LOmb algorithm performs an omnibus permutation test on ensembles of two-locus analyses. The algorithm consists of four main steps: two-locus analysis, a permutation test, global p-value determination and a progressive search for the best ensemble. 2LOmb is benchmarked against an exhaustive two-locus analysis technique, a set association approach, a correlation-based feature selection (CFS) technique and a tuned ReliefF (TuRF) technique. The simulation results indicate that 2LOmb produces a low false-positive error. Moreover, 2LOmb has the best performance in terms of an ability to identify all causative single nucleotide polymorphisms (SNPs) and a low number of output SNPs in purely epistatic two-, three- and four-locus interaction problems. The interaction models constructed from the 2LOmb outputs via a multifactor dimensionality reduction (MDR) method are also included for the confirmation of epistasis detection. 2LOmb is subsequently applied to a type 2 diabetes mellitus (T2D) data set, which is obtained as a part of the UK genome-wide genetic epidemiology study by the Wellcome Trust Case Control Consortium (WTCCC). After primarily screening for SNPs that locate within or near 372 candidate genes and exhibit no marginal single-locus effects, the T2D data set is reduced to 7,065 SNPs from 370 genes. The 2LOmb search in the reduced T2D data reveals that four intronic SNPs in PGM1 (phosphoglucomutase 1), two intronic SNPs in LMX1A (LIM homeobox transcription factor 1, alpha), two intronic SNPs in PARK2 (Parkinson disease (autosomal recessive, juvenile) 2, parkin) and three intronic SNPs in GYS2 (glycogen synthase 2 (liver)) are associated with the disease. The 2LOmb result suggests that there is no interaction between each pair of the identified genes that can be described by purely epistatic two-locus interaction models. Moreover, there are no interactions between these four genes that can be described by purely epistatic multi-locus interaction models with marginal two-locus effects. The findings provide an alternative explanation for the aetiology of T2D in a UK population.
Conclusion: An omnibus permutation test on ensembles of two-locus analyses can detect purely epistatic multi-locus interactions with marginal two-locus effects. The study also reveals that SNPs from large-scale or genome-wide case-control data which are discarded after single-locus analysis detects no association can still be useful for genetic epidemiology studies.
Figures
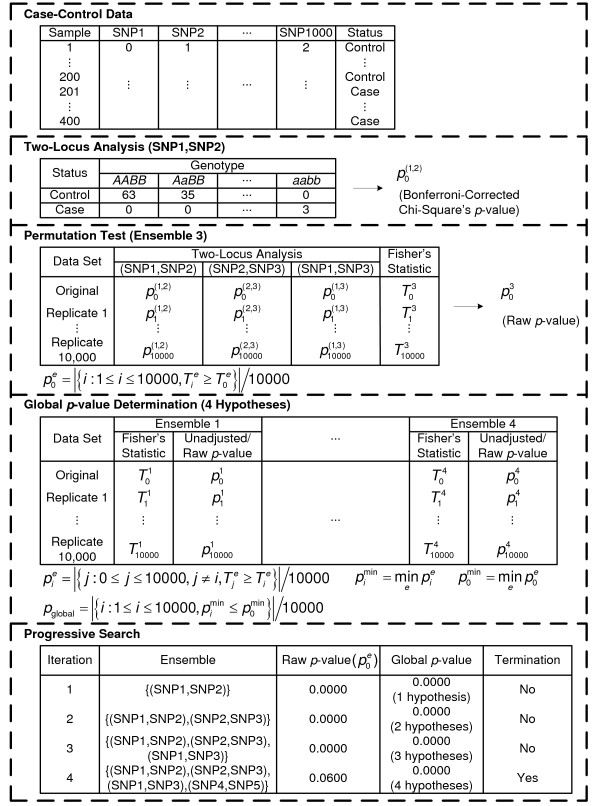
 = 499,500 two-locus analyses. Thus, the Bonferroni-corrected χ2's p-value for each two-locus analysis is the lower value between 499,500 × its uncorrected p-value and one. In one ensemble, Bonferroni-corrected χ2's p-values from multiple two-locus analyses are combined together via a Fisher's combining function, which in turn provides a Fisher's test statistic result. The raw p-value for the ensemble is obtained through a permutation test, which is composed of 10,000 randomised permutation replicates. Since multiple ensembles may be tried during the identification of the best association explanation, a global p-value is calculated to account for multiple hypothesis testing. The global p-value is estimated through the same permutation test that gives the raw p-value for each ensemble. The progressive search for the best association explanation is carried out by incrementally adding a two-SNP unit to the current best ensemble. The condition for search termination is based on both the raw p-value for the explored ensemble and the global p-value. In this example, the search is terminated after the fourth ensemble is explored due to an increase in the raw p-value. Subsequently, the best SNP set for association explanation contains SNP1, SNP2 and SNP3 where the global p-value that accounts for testing of four hypotheses is p < 0.0001.
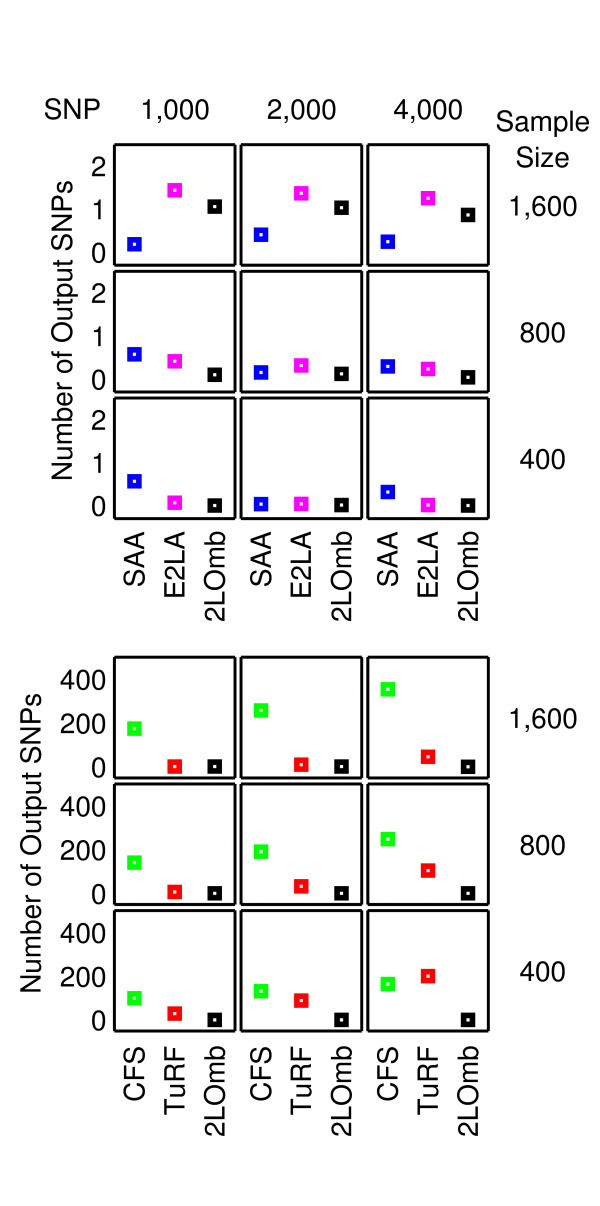
Similar articles
-
An omnibus permutation test on ensembles of two-locus analyses can detect pure epistasis and genetic heterogeneity in genome-wide association studies.Springerplus. 2013 May 19;2:230. doi: 10.1186/2193-1801-2-230. eCollection 2013. Springerplus. 2013. PMID: 24804170 Free PMC article.
-
DualWMDR: Detecting epistatic interaction with dual screening and multifactor dimensionality reduction.Hum Mutat. 2020 Mar;41(3):719-734. doi: 10.1002/humu.23951. Epub 2019 Nov 25. Hum Mutat. 2020. PMID: 31705708
-
Gene, pathway and network frameworks to identify epistatic interactions of single nucleotide polymorphisms derived from GWAS data.BMC Syst Biol. 2012;6 Suppl 3(Suppl 3):S15. doi: 10.1186/1752-0509-6-S3-S15. Epub 2012 Dec 17. BMC Syst Biol. 2012. PMID: 23281810 Free PMC article.
-
Genetic interactions effects for cancer disease identification using computational models: a review.Med Biol Eng Comput. 2021 Apr;59(4):733-758. doi: 10.1007/s11517-021-02343-9. Epub 2021 Apr 11. Med Biol Eng Comput. 2021. PMID: 33839998 Review.
-
A survey about methods dedicated to epistasis detection.Front Genet. 2015 Sep 10;6:285. doi: 10.3389/fgene.2015.00285. eCollection 2015. Front Genet. 2015. PMID: 26442103 Free PMC article. Review.
Cited by
-
Assessing gene-gene interactions in pharmacogenomics.Mol Diagn Ther. 2012 Feb 1;16(1):15-27. doi: 10.1007/BF03256426. Mol Diagn Ther. 2012. PMID: 22352452 Review.
-
Alternative splicing generates different parkin protein isoforms: evidences in human, rat, and mouse brain.Biomed Res Int. 2014;2014:690796. doi: 10.1155/2014/690796. Epub 2014 Jul 16. Biomed Res Int. 2014. PMID: 25136611 Free PMC article.
-
Increasing the Coding Potential of Genomes Through Alternative Splicing: The Case of PARK2 Gene.Curr Genomics. 2014 Jun;15(3):203-16. doi: 10.2174/1389202915666140426003342. Curr Genomics. 2014. PMID: 24955028 Free PMC article.
-
Mining pure, strict epistatic interactions from high-dimensional datasets: ameliorating the curse of dimensionality.PLoS One. 2012;7(10):e46771. doi: 10.1371/journal.pone.0046771. Epub 2012 Oct 12. PLoS One. 2012. PMID: 23071633 Free PMC article.
-
Inferring combinatorial association logic networks in multimodal genome-wide screens.Bioinformatics. 2010 Jun 15;26(12):i149-57. doi: 10.1093/bioinformatics/btq211. Bioinformatics. 2010. PMID: 20529900 Free PMC article.
References
Publication types
MeSH terms
Grants and funding
LinkOut - more resources
Full Text Sources
Research Materials
Miscellaneous
