Meta-Analysis
. 2009 Sep 17:10:440.
doi: 10.1186/1471-2164-10-440.

Phase Coupled Meta-analysis: sensitive detection of oscillations in cell cycle gene expression, as applied to fission yeast

Affiliations
Meta-Analysis

Phase Coupled Meta-analysis: sensitive detection of oscillations in cell cycle gene expression, as applied to fission yeast

Saumyadipta Pyne et al. BMC Genomics. .

Abstract

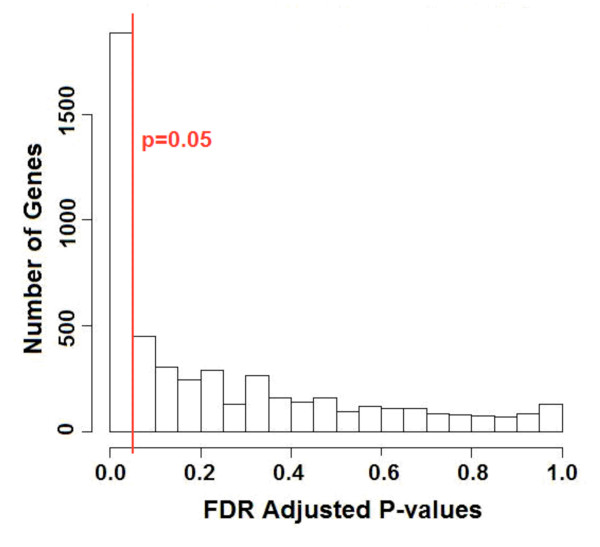
Background: Many genes oscillate in their level of expression through the cell division cycle. Previous studies have identified such genes by applying Fourier analysis to cell cycle time course experiments. Typically, such analyses generate p-values; i.e., an oscillating gene has a small p-value, and the observed oscillation is unlikely due to chance. When multiple time course experiments are integrated, p-values from the individual experiments are combined using classical meta-analysis techniques. However, this approach sacrifices information inherent in the individual experiments, because the hypothesis that a gene is regulated according to the time in the cell cycle makes two independent predictions: first, that an oscillation in expression will be observed; and second, that gene expression will always peak in the same phase of the cell cycle, such as S-phase. Approaches that simply combine p-values ignore the second prediction.

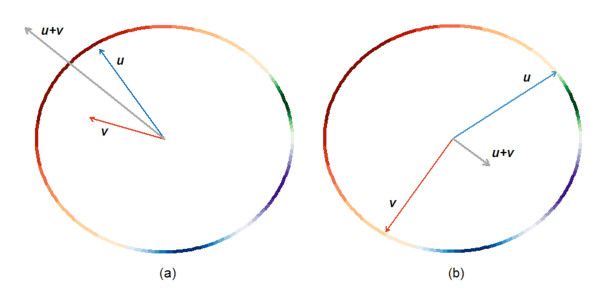
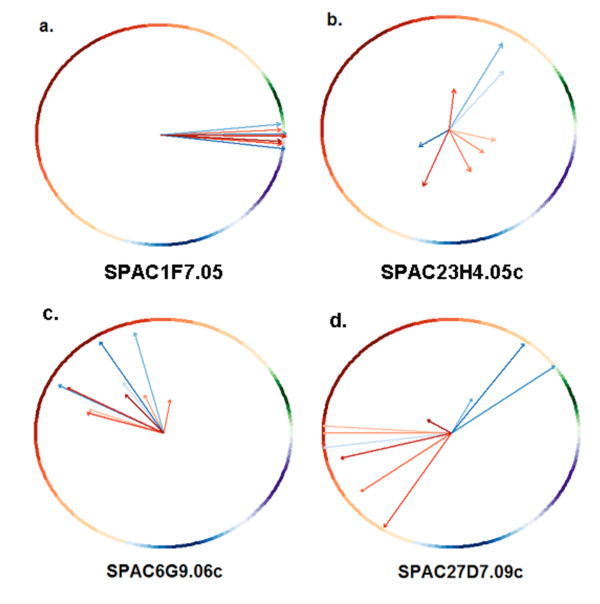
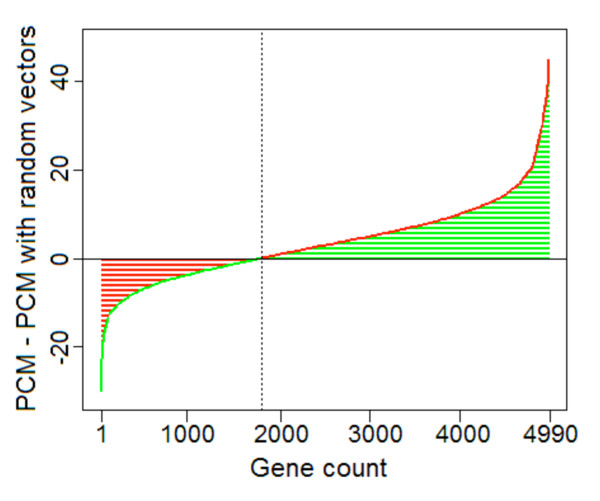
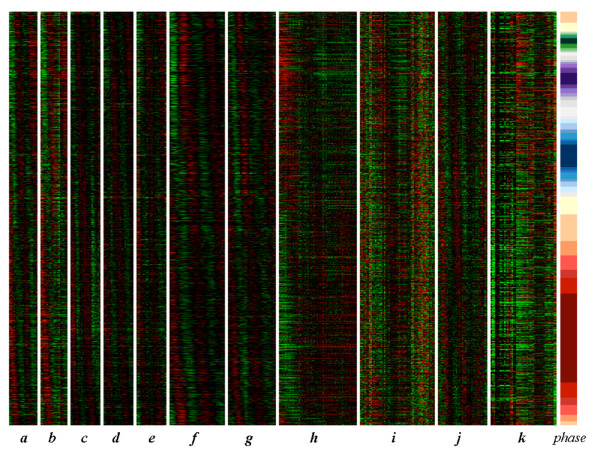
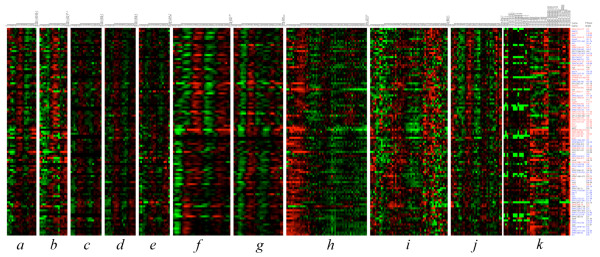
Results: Here, we improve the detection of cell cycle oscillating genes by systematically taking into account the phase of peak gene expression. We design a novel meta-analysis measure based on vector addition: when a gene peaks or troughs in all experiments in the same phase of the cell cycle, the representative vectors add to produce a large final vector. Conversely, when the peaks in different experiments are in various phases of the cycle, vector addition produces a small final vector. We apply the measure to ten genome-wide cell cycle time course experiments from the fission yeast Schizosaccharomyces pombe, and detect many new, weakly oscillating genes.

Conclusion: A very large fraction of all genes in S. pombe, perhaps one-quarter to one-half, show some cell cycle oscillation, although in many cases these oscillations may be incidental rather than adaptive.


Figures

Figure 1
Figure 1
Vector sum based on oscillation and phase. For a gene, each time course is represented by a vector such that the Periodicity and Expression scores determine the magnitude of the vector, and the cell cycle phase of peak expression gives the direction of the vector. Plot (a) shows two hypothetical time courses with similar phases of peak expression (both peaking in G2 phase). In (a), the sum of the two vectors u+v yields a vector (plotted in grey) with a greater magnitude than either of the component vectors. Plot (b) shows two time courses with dissimilar phases of peak expression, one peaking at the beginning of M phase, and the other peaking just after S-phase. The sum of these two vectors u+v yields a vector (in grey) with a lower magnitude than either of the component vectors. The colored circumference refers to the circular distribution of cell cycle phases in S. pombe (red-G2, green-M, purple-G1, blue-S) in both plots.
Figure 2
Figure 2
Four examples genes. A variety of cases are observed: in (a), SPAC1F7.05 (cdc22, ribonucleotide reductase) has both high Periodicity and Expression scores, and also high phase consistency. It is the highest-ranked gene by PCM (rank 1). In (b), SPAC23H4.05c has low Periodicity and Expression scores, and also low phase consistency, leading to a very low PCM rank (4000). In (c), SPAC6G9.06c (pcp1) has mediocre Periodicity and Expression scores, but relatively high phase consistency (PCM rank of 259), and finally (d), SPAC27D7.09c (encoding a but1 family protein) has mostly high Periodicity and Expression scores, but relatively low phase consistency (PCM rank of 1464). In some cases, vectors were intentionally offset by small amounts to avoid overlapping. The colored circumference refers to the circular distribution of cell cycle phases in S. pombe (red-G2, green-M, purple-G1, blue-S), while the vectors in colder (bluish) and warmer (redish) hues represent cdc25 and elutriation experiments respectively.
Figure 3
Figure 3
Specificity and sensitivity of PCM ranks. Each gene is plotted as a 2-dimensional point where the x-coordinate is its PCM rank and the y-coordinate is its Marguerat et al. rank. Genes with higher phase consistency are marked with darker points. Clearly there are many more darker points above the diagonal (y = x) line, suggesting that genes with consistent phases across experiments get higher ranks (i.e. ranked closer to the top) by PCM than Marguerat et al. The sparse upper left quadrant of the plot shows that if genes did not receive a high rank by Marguerat et al., due to their poor Periodicity and Expression scores, then they did not get high a PCM rank either. However, many genes in the lower right quadrant received a high score from Marguerat et al. on the basis of good Periodicity and expression scores, but a low PCM score on the basis of poor phase consistency.
Figure 4
Figure 4
Variation in peak phase consistency captured by PCM ranking. Time courses of genes with different PCM ranks are shown: (a) rank 1; (b) rank 100; (c) rank 500; and (d) rank 1000. High peak phase consistency among the ten independent time courses can be seen for the high PCM ranked genes in plots (a) and (b), while in the lower PCM ranked genes peak phase consistency is less, which can be observed among fewer time courses ((c) and (d)). (The plots in this figure were created with the help of Cyclebase.org due to Gauthier et al.)
Figure 5
Figure 5
Difference of PCM scores with real and random phases. For each gene, the PCM score was computed as sum of vectors (see Methods). Then for the same gene, a random-phase PCM score was computed as sum of vectors with the original magnitudes but randomly-chosen phase angles. For every gene, the difference between its original PCM score and its random-phase PCM score was then computed, and plotted in increasing order from left to right. To the right of the dotted line are 3,200 genes where the difference is positive; i.e., for these genes, the cell cycle phases of peak expression in the time courses are less variable than the randomly distributed phases.
Figure 6
Figure 6
Statistical significance of cross-experiment phase consistency. Approximately 1,900 genes can be rejected at level 0.05 for the null hypothesis that their peak phases across experiments are distributed uniformly over a circular range.
Figure 7
Figure 7
Periodic oscillation of 1,275 "non-periodic" genes. After removal of genes identified as periodic in the Oliva et al. and Marguerat et al. studies from the top 2,000 PCM ranked genes, there are 1,275 genes remaining. In this figure, these 1,275 genes are stacked top to bottom in phase order. Cyclic behavior is apparent. The time courses a-e are from Rustici et al., f-g from Peng et al., and h-j from Oliva et al. Block k consists of samples from transcription factor knockout and overexpression experiments (i.e., this block does not contain a cell cycle experiment). The color band "Phase" marks the phase distribution (red-G2, green-M, purple-G1, blue-S). A high resolution version is available in additional file 3.
Figure 8
Figure 8
The enhanced ribosomal biogenesis cluster Cribo. The 103 genes constituting the "Cribo" cluster, expression of these genes peaks in G2 phase. The genes in this cluster are marked with 'Cribo' in the PCM rank list (Additional file 1). The time courses a-e are from Rustici et al., f-g from Peng et al., and h-j from Oliva et al. Block k consists of samples from transcription factor knockout and overexpression experiments. A high resolution version is available in additional file 4.

Similar articles

Cited by

References

    1. Cho RJ, Campbell MJ, Winzeler EA, Steinmetz L, Conway A, Wodicka L, Wolfsberg TG, Gabrielian AE, Landsman D, Lockhart DJ, et al. A genome-wide transcriptional analysis of the mitotic cell cycle. Molecular cell. 1998;2:65–73. doi: 10.1016/S1097-2765(00)80114-8. - DOI - PubMed
    1. Laub MT, McAdams HH, Feldblyum T, Fraser CM, Shapiro L. Global analysis of the genetic network controlling a bacterial cell cycle. Science (New York, NY) 2000;290:2144–2148. - PubMed
    1. Menges M, Hennig L, Gruissem W, Murray JA. Cell cycle-regulated gene expression in Arabidopsis. The Journal of biological chemistry. 2002;277:41987–42002. doi: 10.1074/jbc.M207570200. - DOI - PubMed
    1. Spellman PT, Sherlock G, Zhang MQ, Iyer VR, Anders K, Eisen MB, Brown PO, Botstein D, Futcher B. Comprehensive identification of cell cycle-regulated genes of the yeast Saccharomyces cerevisiae by microarray hybridization. Molecular biology of the cell. 1998;9:3273–3297. - PMC - PubMed
    1. Whitfield ML, Sherlock G, Saldanha AJ, Murray JI, Ball CA, Alexander KE, Matese JC, Perou CM, Hurt MM, Brown PO, et al. Identification of genes periodically expressed in the human cell cycle and their expression in tumors. Molecular biology of the cell. 2002;13:1977–2000. doi: 10.1091/mbc.02-02-0030.. - DOI - PMC - PubMed

Publication types

MeSH terms

LinkOut - more resources