

Classification of degraded cartilage through multiparametric MRI analysis
- PMID: 19762258
- PMCID: PMC2766527
- DOI: 10.1016/j.jmr.2009.08.001
Classification of degraded cartilage through multiparametric MRI analysis
Abstract
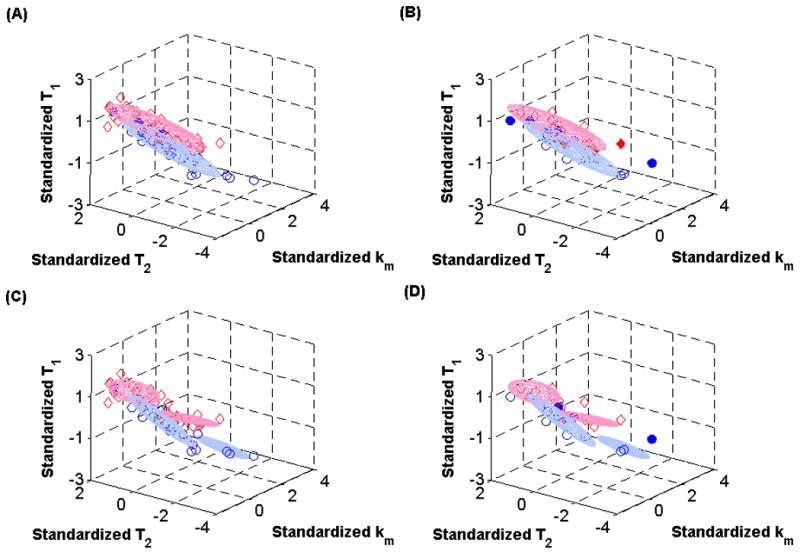
MRI analysis of cartilage matrix may play an important role in early detection and development of therapeutic protocols for degenerative joint disease. Correlations between MRI parameters and matrix integrity have been established in many studies, but the substantial overlap in values observed for normal and for degraded cartilage greatly limits the specificity of these analyses. We implemented established multiparametric analysis methods to define data clusters corresponding to control and degraded bovine nasal cartilage in two-, three-, and four-dimensional parameter spaces, and applied these results to discriminant analysis of a validation data set. Analyses were performed using the parameters (T(1), T(2), k(m), ADC), where k(m) is the magnetization transfer rate and ADC is the apparent diffusion coefficient. Results were compared to univariate analyses. Multiparametric k-means clustering led to no improvement over univariate analyses, with a maximum sensitivity and specificity in the range of 60-70% for the detection of degradation using T(1), and in the range of 80% sensitivity but only 36% specificity using the parameter pair (T(1), k(m)). In contrast, model-based analysis using more general Gaussian clusters resulted in markedly improved classification, with sensitivity and specificity reaching levels of 80-90% using the pair (T(1), k(m)). Finally, a fuzzy clustering technique was implemented which may be still more appropriate to the continuum of degradation seen in degenerative cartilage disease. In view of its success in identifying mild cartilage degradation, the formal multiparametric approach implemented here may be applicable to the nondestructive evaluation of other biomaterials using MRI.
Figures


References
-
- Gold GE, Beaulieu CF. Future of MR imaging of articular cartilage. Semin Musculoskelet Radiol. 2001;5:313–27. - PubMed
-
- Mosher TJ, Dardzinski BJ. Cartilage MRI T2 relaxation time mapping: Overview and applications. Seminars In Musculoskeletal Radiology. 2004;8:355–368. - PubMed
-
- Burstein D, Bashir A, Gray ML. MRI techniques in early stages of cartilage disease. Invest Radiol. 2000;35:622–38. - PubMed
-
- Laurent D, Wasvary J, Yin J, Rudin M, Pellas TC, O'Byrne E. Quantitative and qualitative assessment of articular cartilage in the goat knee with magnetization transfer imaging. Magnetic Resonance Imaging. 2001;19:1279. - PubMed
-
- Menezes NM, Gray ML, Hartke JR, Burstein D. T-2 and T-1, MRI in articular cartilage systems. Magnetic Resonance In Medicine. 2004;51:503–509. - PubMed
Publication types
MeSH terms
Substances
Grants and funding
LinkOut - more resources
Full Text Sources
