Review
. 2009 Sep;13(3):149-80.
doi: 10.1177/1084713809348372.

Auditory midbrain implant: a review

Affiliations
Review

Auditory midbrain implant: a review

Hubert H Lim et al. Trends Amplif. 2009 Sep.

Abstract

The auditory midbrain implant (AMI) is a new hearing prosthesis designed for stimulation of the inferior colliculus in deaf patients who cannot sufficiently benefit from cochlear implants. The authors have begun clinical trials in which five patients have been implanted with a single shank AMI array (20 electrodes). The goal of this review is to summarize the development and research that has led to the translation of the AMI from a concept into the first patients. This study presents the rationale and design concept for the AMI as well a summary of the animal safety and feasibility studies that were required for clinical approval. The authors also present the initial surgical, psychophysical, and speech results from the first three implanted patients. Overall, the results have been encouraging in terms of the safety and functionality of the implant. All patients obtain improvements in hearing capabilities on a daily basis. However, performance varies dramatically across patients depending on the implant location within the midbrain with the best performer still not able to achieve open set speech perception without lip-reading cues. Stimulation of the auditory midbrain provides a wide range of level, spectral, and temporal cues, all of which are important for speech understanding, but they do not appear to sufficiently fuse together to enable open set speech perception with the currently used stimulation strategies. Finally, several issues and hypotheses for why current patients obtain limited speech perception along with several feasible solutions for improving AMI implementation are presented.


Figures

Figure 1.
Figure 1.
Cochlear implant (CI) system. There are many types of CI systems with different processor designs and electrode arrays. This image presents a behind-the-ear CI system developed by Cochlear Ltd. It consists of a small processor that fits behind the ear with a microphone located near the white tip (not shown). The processor communicates with the receiver-stimulator implanted in a bony bed in the skull beneath the skin surface through a telemetry interface (brown coil). The ground ball electrode connected to the receiver-stimulator is placed within the temporalis muscle whereas the electrode array is positioned within the cochlea with the 22 electrodes aligned along its tonotopic gradient. The electrodes are designed to stimulate the remaining nerve fibers that exit to the right of the image. Image printed with permission from Cochlear Ltd.
Figure 2.
Figure 2.
Auditory brainstem implant array. An example of an electrode array, developed by Cochlear Ltd., designed for surface stimulation of the cochlear nucleus for hearing restoration. This array consists of 21 active platinum disk electrodes mounted on a 3 × 8.5 mm silicone carrier backed with PET mesh (additional flaps to fix array to tissue surface). Each of the electrodes has a diameter of about 0.7 mm. Image printed with permission from Cochlear Ltd.
Figure 3.
Figure 3.
Simplified brain schematic showing locations of different auditory implants. Both the penetrating auditory brainstem implant (PABI) and auditory midbrain implant (AMI) are in clinical trials. All the devices shown have been developed by Cochlear Ltd. though other auditory brainstem implants (ABIs) and cochlear implants (CIs) have been developed by various companies.
Figure 4.
Figure 4.
Anatomy of inferior colliculus (IC). Histological sections of the human IC depicting its different subdivisions and layered structure using the Golgi–Cox method. (A) Axial section (top) at the junction of the caudal and middle thirds of the IC of a 55-year-old man, and its simplified schematic (bottom) showing the orientation of the dendritic laminae within the central nucleus. (B) Parasagittal section at the junction of the medial and middle thirds of the IC of a 53-year-old man; inset provides orientation of the dendritic laminae within the central nucleus and indicates the location of the section (dashed lines). (C) Cuneiform area.
Figure 5.
Figure 5.
Auditory midbrain implant (AMI) array. (A) Image of the AMI array next to a standard deep brain stimulation (DBS) array (Medtronic Inc., Minneapolis, MN). The DBS array consists of four platinum–iridium contacts (2 mm center-to-center separation) each with a ring diameter of 1.27 mm, width of 1.5 mm, and surface area of ∼6 mm2. (B) Magnified image of the AMI array, which is 6.2 mm long (from Dacron mesh to tip of silicone carrier without stylet). Each of the 20 platinum ring electrodes (0.2 mm center-to-center separation) has a diameter of 0.4 mm, width of 0.1 mm, and surface area of ∼0.00126 mm2. The AMI array is designed to be positioned along the tonotopic gradient of the central nucleus of the inferior colliculus (IC). The array was developed by Cochlear Ltd.
Figure 6.
Figure 6.
Auditory midbrain implant (AMI) electrophysiology setup in guinea pig. Drawings of the AMI array and an 8-shank silicon-substrate Michigan probe (Center for Neural Communication Technology, University of Michigan, Ann Arbor, MI) positioned along the tonotopic gradient of the central nucleus of the inferior colliculus (ICC) (A) and primary auditory cortex (A1) (B), respectively. Anatomy in (A) and (B) was derived from images presented in Malmierca, Rees, Le Beau, and Bjaalie (1995) and Wallace, Rutkowski, and Palmer (2000), respectively (not drawn to scale). Electrode sites (∼400 μm2) are represented by black dots along each A1 probe shank (sites separated by 50 μm, shanks separated by 200 μm). The asterisk corresponds to blood vessels.
Figure 7.
Figure 7.
Stimulation thresholds. (A) Electrical thresholds for neural activation recorded on sites within the primary auditory cortex (A1) with the closest best frequency (BF) to the stimulated auditory midbrain implant (AMI) sites (n = 75). (B) Electrical thresholds for neural activation on A1 sites (selected from all 16 sites for a given A1 probe placement) with the lowest threshold for the stimulated AMI sites (n = 75).
Figure 8.
Figure 8.
Best frequency (BF) mapping plots. These plots demonstrate that stimulation of the central nucleus of the inferior colliculus (ICC) with our auditory midbrain implant (AMI) array achieves frequency-specific activation within the primary auditory cortex (A1). (A) The BF of the A1 site with the lowest threshold for a stimulated AMI site is plotted against the BF of that AMI site. Diagonal line depicts perfect mapping, which is not always possible due to the set geometry of the electrode sites thus inherent BF misalignment. Symbols: ·, closest BF site; Δ, 1 to 2 sites away from closest BF site;, >2 sites away. Distribution of symbols: ·, n = 23; Δ, n = 27;, n = 25. (B) The BF of the A1 site with the largest evoked potential peak for a stimulated AMI site (at 5 dB above threshold) is plotted against the BF of that AMI site. Symbols: · closest BF site; A, 1 to 2 sites away from closest BF site;, >2 sites away. Distribution of symbols: ·, n = 37; Δ, n = 16;, n = 16.
Figure 9.
Figure 9.
Histological summary for the auditory midbrain implant array. (A, B) Neuron density versus distance from electrode track for the nonstimulated and stimulated cats. (C, D) Glial cell density versus distance from electrode track for the nonstimulated and stimulated cats. Plots include mean across all animals (4 nonstimulated, 4 stimulated), standard deviation bars, and asterisks above the implanted/stimulated mean values that were significantly different from the control values. For further details on the analysis methods, see Lenarz et al. (2007).
Figure 10.
Figure 10.
Surgical approach to the inferior colliculus (IC). (A) Schematic drawing of the fixed head in a semisitting position and showing the skin incision (red dotted line), appropriate location for the receiver-stimulator of the auditory midbrain implant (AMI) in the temporoparietal area (red star), and the location of the modified lateral suboccipital craniotomy (yellow circle) exposing the inferior margin of the transverse sinus and the medial margin of the sigmoid sinus (blue shaded regions). The antenna placed at the top of the head is for the three-dimensional intraoperative navigation system. (B) After the skull is removed and the dura flaps pulled to the side, the tentorium (T) and cerebellum (C) are visible. The cerebellum is retracted medially (right) to expose the auditory nerve and tumor. Because of gravity, the cerebellum drops downward to expose the IC. (C) View of the left IC, trochlear nerve (TN), and the caudal branch of the superior cerebellar artery (SCA) through the lateral supracerebellar infratentorial approach after the neurosurgeon has removed the overlying arachnoid and pushed aside several blood vessels. (D) The cable extends from the AMI array that has been implanted into the IC.
Figure 11.
Figure 11.
Array placement across patients. Parasagittal (top) and axial (bottom) sections showing the location and orientation of the array within the midbrain of each patient. Arrow in parasagittal section points to the caudorostral location of the array and the corresponding axial section below. The black line (or dot for AMI-2) representing the array in each section corresponds to the trajectory of the array across several superimposed computed tomography–magnetic resonance imaging (CT-MRI) slices.
Figure 12.
Figure 12.
Surgical exposure of the left human midbrain for array implantation. The midline, superior colliculus (SC), trochlear nerve (TN), and inferior colliculus (IC) are visible. However, the caudal edge of the IC and true midline are not clearly visible with the angled view of the midbrain. The asterisk corresponds to the hypothesized location of the start of the brachium of the IC based on surface IC stimulation results presented in Figure 15 and described in the section “Placement of the Array.”
Figure 13.
Figure 13.
Activation levels for auditory midbrain implant stimulation. Threshold (T) and comfortable (C) levels measured in each patient using 500 ms on–off pulse trains with 250 pps, 100 μs/phase monopolar pulses. (A) T-C levels (endpoints of bar) for AMI-1 measured for four different time points (symbols) from when the implant was initially turned on. Because of rising levels over time, the implant was turned off for 48 days (after the +127 day measurement) and then T-C levels were measured again. At +4 days, only the modified T-C levels used for the daily processor rather than the actual measured values were available. Thus they are labeled with an open symbol and lighter shaded bars. (B, C) T-C levels for AMI-2 and AMI-3 measured at two different time points and demonstrating stability over time. (D) Summary of values for each patient only for the values from the first testing session shown in A, B, and C. Asterisks correspond to sites shorted to other inactive sites, except for Site 3 (shorted to active Site 9) for AMI-1, that were turned off.
Figure 14.
Figure 14.
Speech scores for AMI-3 at 1 year. Vowel test (chance level of 10%) consisted of five long (e.g., BAAT, GAAT) and five short (e.g., BAT, GAT) words randomly read to the patient (four times) and the patient had to repeat the word. Consonant test (chance level of 7.7%) consisted of 13 meaningless consonant words (e.g., ABA, AGA) repeated four times. Freiburger number test (open set, chance level <1%) consisted of 20 German numbers between 13 and 99 (2 to 5 syllables). Speech tracking (modified open set, chance level of 0%) involved reading a story to the patient who was asked to repeat the words of the cited sentences. The number of correct words in 5 minutes was obtained and divided by 5 to obtain the correct number of words per minute. V (visual), lip reading alone; A (audio), implant alone; AV (audiovisual), both lip reading and implant. Lip reading enhancement is the difference between AV and V. All scores are the average across two testing sessions. Further details on the methods are presented in Lim et al. (2007).
Figure 15.
Figure 15.
Surface midbrain stimulation method. Electrically evoked middle latency responses were recorded to surface midbrain stimulation during implant surgery under sufentanil anesthesia. A bipolar electrode is positioned in three different locations (top images) and stimulated to induce evoked potentials (bottom plots) recorded with surface needles (signal, high forehead; reference, nape of neck; ground, low forehead). The stimulus consisted of a short burst of 5 pulses (100 μs/phase, 7 μs interphase gap) at 1,200 pps, which was repeated at 7.4 Hz. The current level was 220 CU (a level unit used by the Freedom implant system from Cochlear Ltd.), which corresponds to 930 μA. The curves are averages of 500 stimulus repetitions. The abscissa of the curves corresponds to time in milliseconds and the ordinate corresponds to amplitude in microvolts. A millimeter scale was placed on the surface of the midbrain and is visible to the right of the electrode. The evoked response increases in magnitude as the electrode stimulates a more rostral and lateral surface location. If the start of the brachium of the inferior colliculus corresponds to where the response begins to increase in magnitude, then it should be located somewhere between the “middle” and “more caudal-medial” positions, which is how we estimated its location in Figure 12.
Figure 16.
Figure 16.
Inferior colliculus stimulation setup in guinea pig. Drawings of the multisite probes positioned along the tonotopic axis of the inferior colliculus central nucleus (ICC) (A) and a best frequency column of the primary auditory cortex (A1) (B). Anatomy in A and B were derived from images presented in Malmierca, Rees, Le Beau, and Bjaalie (1995) and Wallace, Rutkowski, and Palmer (2000), respectively (simplified and not drawn to scale). Asterisk corresponds to blood vessels.
Figure 17.
Figure 17.
Stimulation location effects on thresholds. (A) Contour plot of activation thresholds recorded in the primary auditory cortex (A1) as a function of stimulation location along the laminae within the central nucleus of the inferior colliculus (ICC). Dots correspond to each location (n = 44). For thresholds greater than our maximum level of 56.2 μA, we set them equal to 60 μA for better visualization of the gradient. (B) Thresholds as a function of stimulation location along the steepest gradient axis from (A) (black line), which is aligned 11° off the caudorostral direction. 0 (along abscissa) corresponds to location of open circle in (A).
Figure 18.
Figure 18.
Summary of stimulation location effects. Schematic describing the effects of stimulation location within an isofrequency lamina of the central nucleus of the inferior colliculus on different coding parameters calculated from the elicited activity in the main input layer of the primary auditory cortex (A1). Arrows indicate how different parameter values (labeled with text) change for stimulation along an ICC lamina that were estimated from our data presented in (Lim & Anderson, 2007). The different shaded regions (light vs. dark gray) represent, in a simplified manner, two functionally distinct regions that appear to exist within an ICC lamina for output projections ascending to A1. Results correspond to laminae with best frequencies between 9 and 23 kHz.
Figure 19.
Figure 19.
Simplified schematic of segregated functional pathways. There appears to exist some segregation of functional pathways corresponding to different coding properties from the brainstem up through the inferior colliculus central nucleus (ICC), ventral division of the medial geniculate body (MGBv), and several subregions of the auditory cortex as described in previous animal studies (Cant & Benson, 2006, 2007; Lim & Anderson, 2007; Rodrigues-Dagaeff et al., 1989). There exists at least two segregated functional pathways originating from the ICC and maintained up to the auditory cortex in which one pathway (dark gray) corresponds to properties that may be more favorable for an auditory midbrain implant. Note that there are some overlapping projections across regions that are not displayed.
Figure 20.
Figure 20.
Thresholds versus pulse rate for midbrain stimulation. Current thresholds (in dB relative to 1 mA) are plotted as a function of pulse rate (75, 150, 250, 500, 720, 900, 1200, 2400 pps) for two sites (e.g., s2, s5, etc.) in each patient. Stimuli consisted of 500 ms pulse trains (100 μs/phase, 7 μs interphase gap, cathodic-leading pulses) repeated at 1 Hz. Dashed line corresponds to a rate of 250 pps, which is the rate at which all curves across patients, thus for different midbrain regions, began to flatten out.
Figure 21.
Figure 21.
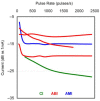
Threshold versus pulse rate across implant patients. Threshold (in dB) versus pulse rate curves for cochlear implant (CI, green), auditory brainstem implant (ABI, red), and auditory midbrain implant (AMI, blue) stimulation. CI and ABI data were obtained from patients in our clinic. One typical CI curve (taken from 9 examples across 9 patients), several ABI curves (3 distinct curves observed across 15 examples from 9 patients), and one typical AMI example from Figure 20 are included. The shape of the CI curve differs dramatically from the AMI curve. The ABI curves can have a shape similar to the CI curve or the AMI curve suggesting that properties relating to pulse rate stimulation may be shifting from the cochlea up to the midbrain in which the brainstem represents the transition point.

References

    1. Adams J. S., Hasenstab M. S., Pippin G. W., Sismanis A. (2004). Telephone use and understanding in patients with cochlear implants. Ear, Nose, & Throat Journal, 83, 6, 99–100, 102–103 - PubMed
    1. Ammirati M., Bernardo A., Musumeci A., Bricolo A. (2002). Comparison of different infratentorial-supracerebellar approaches to the posterior and middle incisural space: A cadaveric study. Journal of Neurosurgery, 97, 922–928 - PubMed
    1. Andersen R. A., Roth G. L., Aitkin L. M., Merzenich M. M. (1980). The efferent projections of the central nucleus and the pericentral nucleus of the inferior colliculus in the cat. Journal of Comparative Neurology, 194, 649–662 - PubMed
    1. Anderson D. J. (2008). Penetrating multichannel stimulation and recording electrodes in auditory prosthesis research. Hearing Research, 242, 31–41 - PubMed
    1. Andreev A. M., Gersuni G. V., Volokhov A. A. (1935). On the electrical excitability of the human ear: On the effect of alternating currents on the affected auditory apparatus. Journal of Physiology USSR, 18, 250–265

Publication types

MeSH terms