. 2009 Sep 18;325(5947):1544-9.
doi: 10.1126/science.1174671.

Three-dimensional structural view of the central metabolic network of Thermotoga maritima

Affiliations

Three-dimensional structural view of the central metabolic network of Thermotoga maritima

Ying Zhang et al. Science. .

Abstract

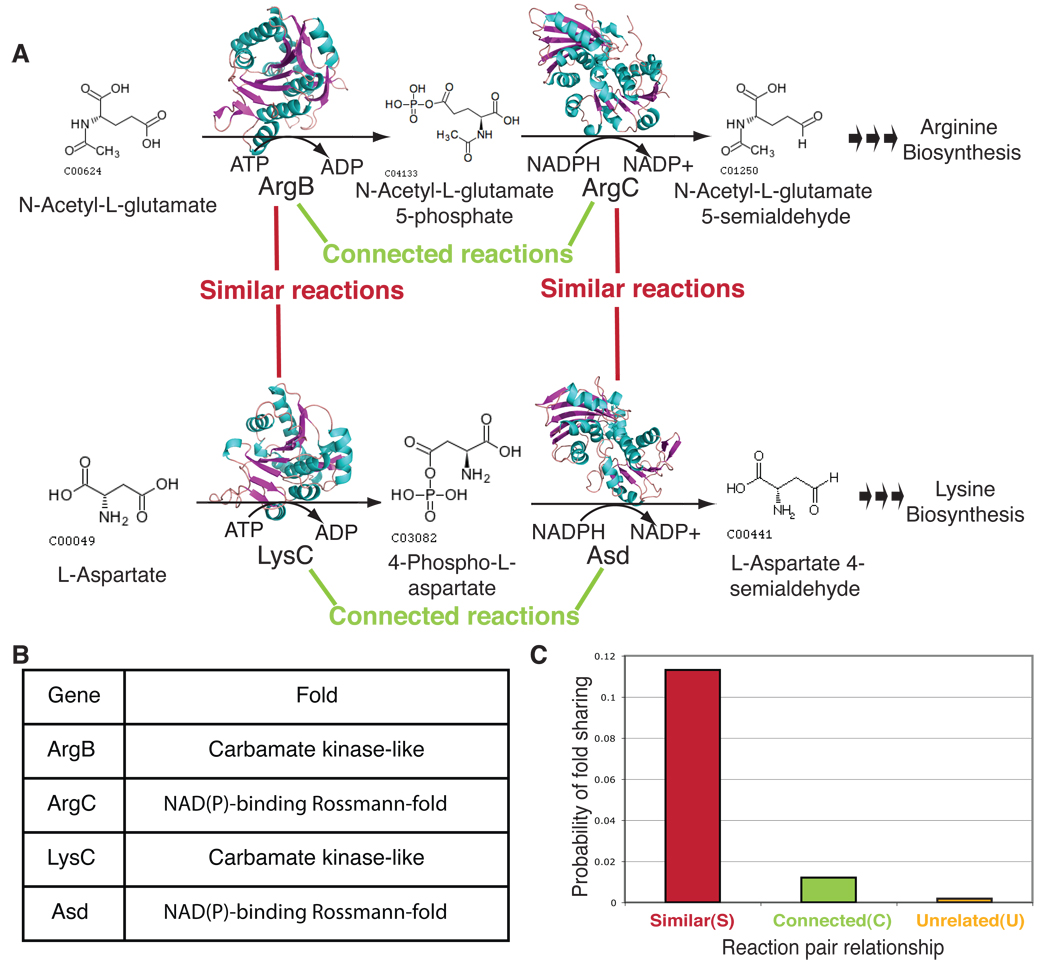
Metabolic pathways have traditionally been described in terms of biochemical reactions and metabolites. With the use of structural genomics and systems biology, we generated a three-dimensional reconstruction of the central metabolic network of the bacterium Thermotoga maritima. The network encompassed 478 proteins, of which 120 were determined by experiment and 358 were modeled. Structural analysis revealed that proteins forming the network are dominated by a small number (only 182) of basic shapes (folds) performing diverse but mostly related functions. Most of these folds are already present in the essential core (approximately 30%) of the network, and its expansion by nonessential proteins is achieved with relatively few additional folds. Thus, integration of structural data with networks analysis generates insight into the function, mechanism, and evolution of biological networks.


Figures

Fig. 1
Fig. 1
Combining metabolic reconstruction and structural genomics approaches for an integrated annotation of the T. maritima central metabolic network. Underlying genomics information (bottom) enabled both a metabolic reconstruction (left subpanel) and an atomic-level structure determination/modeling of all T. maritima proteins (right subpanel). Integration of these two approaches enabled detailed information to be acquired for every reaction in the network (upper subpanel); an example from the T. maritima serine degradation pathway is illustrated (28).
Fig. 2
Fig. 2
Classification of metabolic reactions. (A) Examples of Similar (S), Connected (C), and Unrelated (U) reactions from the Arginine and Lysine biosynthesis pathways. ArgB and LysC share a co-substrate (ATP) that undergoes the same transformation (to ADP + Pi). Similarly, ArgC and Asd transform NADPH to NADP+. By these criteria, both pairs are classified as Similar (S). At the same time, reaction pairs ArgB/ArgC and LysC/Asd are adjacent in the pathway, since the product of the first reaction is the substrate for the next. These reaction pairs are classified as Connected (C). All other pairs of reactions (ArgB/Asd, ArgC/LysC) are classified as Unrelated (U). In this example, only the enzymes classified as similar (ArgB/LysC and ArgC/Asd) have the same fold. (B) Detailed information on the enzymes in subpanel A. (C) Bars representing the relative number of pairs with the same fold in each category of reactions.
Fig. 3
Fig. 3
Distribution of folds in the mrTM protein set with the most overrepresented folds illustrated by structural ribbon diagrams. SCOP (32) fold codes are shown on the x-axis with the observed frequency on the y-axis. The expected frequency for each fold in the NCBI non-redundant database (33) is shown as a magenta trace.
Fig. 4
Fig. 4
Fold composition of the non-essential, synthetic lethal, and core-essential protein sets (see text for details) illustrated by colors associated with different folds. The x-axis represents the number of simulations that resulted in identification of core-essential (1000 appearances in 1000 simulations), synthetic lethal (from 999 to 1), and non-essential genes (0), and their classification on the y-axis into SCOP fold categories. Inset: cumulative fold coverage of core-essential and non-essential protein sets (blue: core-essential; magenta: non-essential). Note the fold distribution in all three groups is different, although core-essential and non-essential have some weak similarity than either group compared to synthetic lethal.

References

    1. Karp PD. Science. 2001;293:2040. - PubMed
    1. Ideker T, Lauffenburger D. Trends Biotechnol. 2003;21:255. - PubMed
    1. Joyce AR, Palsson BO. Prog. Drug. Res. 2007;64:265. - PubMed
    1. Duarte NC, et al. Proc. Natl. Acad. Sci. U.S.A. 2007;104:1777. - PubMed
    1. Feist AM, et al. Mol. Syst. Biol. 2007;3:121. - PMC - PubMed

Publication types