

Development of stepwise osteogenesis-mimicking matrices for the regulation of mesenchymal stem cell functions
- PMID: 19762920
- PMCID: PMC2781515
- DOI: 10.1074/jbc.M109.054676
Development of stepwise osteogenesis-mimicking matrices for the regulation of mesenchymal stem cell functions
Abstract
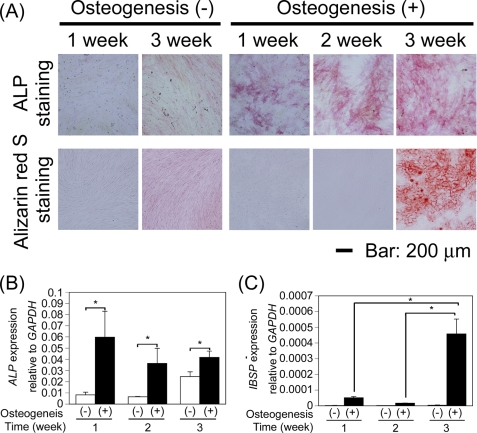
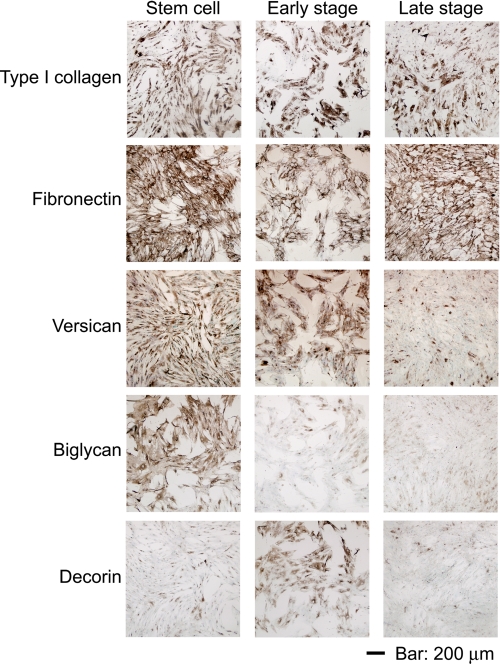
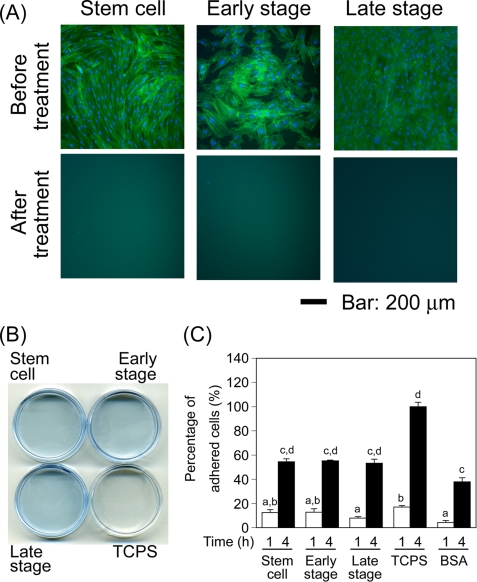
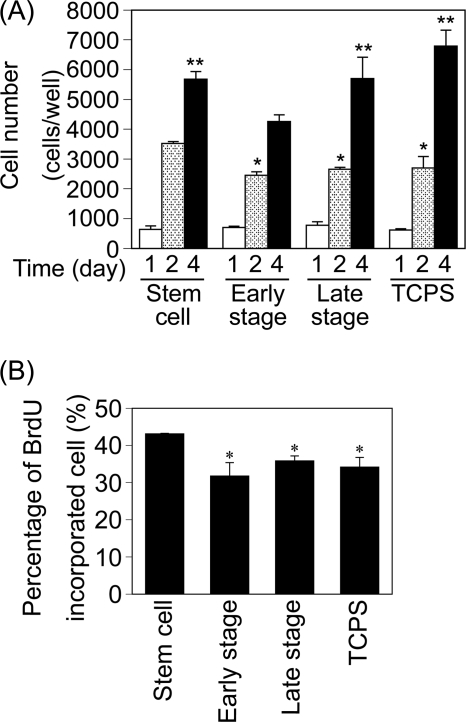
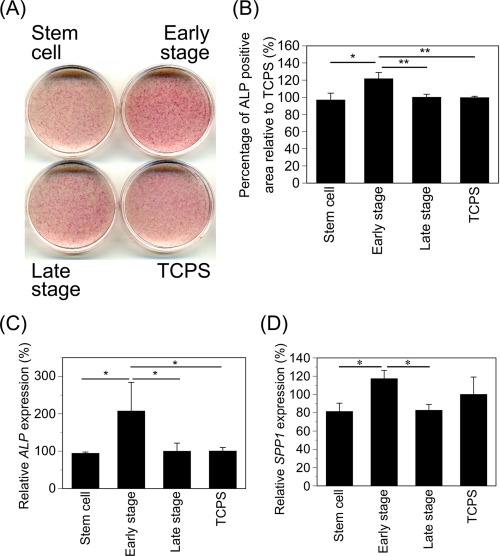
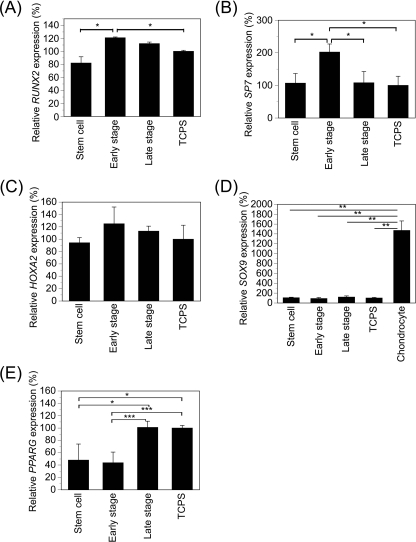
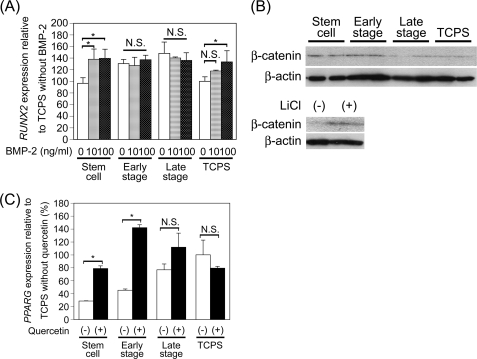
An extracellular microenvironment, including an extracellular matrix (ECM), is an important factor in regulating stem cell differentiation. During tissue development, the ECM is dynamically remodeled to regulate stem cell functions. Here, we developed matrices mimicking ECM remodeling during the osteogenesis of mesenchymal stem cells (MSCs). The matrices were prepared from cultured MSCs controlled at different stages of osteogenesis and referred to as "stepwise osteogenesis-mimicking matrices." The matrices supported the adhesion and proliferation of MSCs and showed different effects on the osteogenesis of MSCs. On the matrices mimicking the early stage of osteogenesis (early stage matrices), the osteogenesis occurred more rapidly than did that on the matrices mimicking undifferentiated stem cells (stem cell matrices) and the late stage of osteogenesis (late stage matrices). RUNX2 was similarly expressed when MSCs were cultured on both the early stage and late stage matrices but decreased on the stem cell matrices. PPARG expression in the MSCs cultured on the late stage matrices was higher than for those cultured on the stem cell and early stage matrices. This increase of PPARG expression was caused by the suppression of the amount of beta-catenin and downstream signal transduction. These results demonstrate that the osteogenesis-mimicking matrices had different effects on the osteogenesis of MSCs, and the early stage matrices provided a favorable microenvironment for the osteogenesis.
Figures
Similar articles
-
Mechanism of regulation of PPARG expression of mesenchymal stem cells by osteogenesis-mimicking extracellular matrices.Biosci Biotechnol Biochem. 2011;75(11):2099-104. doi: 10.1271/bbb.110274. Epub 2011 Nov 7. Biosci Biotechnol Biochem. 2011. PMID: 22056426
-
Matrices secreted during simultaneous osteogenesis and adipogenesis of mesenchymal stem cells affect stem cells differentiation.Acta Biomater. 2016 Apr 15;35:185-93. doi: 10.1016/j.actbio.2016.02.009. Epub 2016 Feb 9. Acta Biomater. 2016. PMID: 26873367
-
The balance of osteogenic and adipogenic differentiation in human mesenchymal stem cells by matrices that mimic stepwise tissue development.Biomaterials. 2012 Mar;33(7):2025-31. doi: 10.1016/j.biomaterials.2011.11.061. Epub 2011 Dec 15. Biomaterials. 2012. PMID: 22177287
-
Effects of nanofibers on mesenchymal stem cells: environmental factors affecting cell adhesion and osteogenic differentiation and their mechanisms.J Zhejiang Univ Sci B. 2020 Nov.;21(11):871-884. doi: 10.1631/jzus.B2000355. J Zhejiang Univ Sci B. 2020. PMID: 33150771 Free PMC article. Review.
-
Mechanosensitive Non-Coding RNAs in Osteogenesis of Mesenchymal Stem Cells.Cell Transplant. 2021 Jan-Dec;30:9636897211051382. doi: 10.1177/09636897211051382. Cell Transplant. 2021. PMID: 34628953 Free PMC article. Review.
Cited by
-
Development of a Biomimetic Hydrogel Based on Predifferentiated Mesenchymal Stem-Cell-Derived ECM for Cartilage Tissue Engineering.Adv Healthc Mater. 2021 Apr;10(8):e2001847. doi: 10.1002/adhm.202001847. Epub 2021 Mar 1. Adv Healthc Mater. 2021. PMID: 33646595 Free PMC article.
-
Nanoengineered, cell-derived extracellular matrix influences ECM-related gene expression of mesenchymal stem cells.Biomater Res. 2018 Oct 5;22:32. doi: 10.1186/s40824-018-0141-y. eCollection 2018. Biomater Res. 2018. PMID: 30323947 Free PMC article.
-
Extracellular matrix from decellularized mesenchymal stem cells improves cardiac gene expressions and oxidative resistance in cardiac C-kit cells.Regen Ther. 2019 May 10;11:8-16. doi: 10.1016/j.reth.2019.03.006. eCollection 2019 Dec. Regen Ther. 2019. PMID: 31193142 Free PMC article.
-
Design of experiments approach to engineer cell-secreted matrices for directing osteogenic differentiation.Ann Biomed Eng. 2011 Apr;39(4):1174-85. doi: 10.1007/s10439-010-0217-x. Epub 2010 Dec 1. Ann Biomed Eng. 2011. PMID: 21120695 Free PMC article.
-
Osteoblast-released Matrix Vesicles, Regulation of Activity and Composition by Sulfated and Non-sulfated Glycosaminoglycans.Mol Cell Proteomics. 2016 Feb;15(2):558-72. doi: 10.1074/mcp.M115.049718. Epub 2015 Nov 23. Mol Cell Proteomics. 2016. PMID: 26598647 Free PMC article.
References
-
- D'Amour K. A., Bang A. G., Eliazer S., Kelly O. G., Agulnick A. D., Smart N. G., Moorman M. A., Kroon E., Carpenter M. K., Baetge E. E. (2006) Nat. Biotechnol. 24, 1392–1401 - PubMed
-
- Daley W. P., Peters S. B., Larsen M. (2008) J. Cell Sci. 121, 255–264 - PubMed
-
- Pittenger M. F., Mackay A. M., Beck S. C., Jaiswal R. K., Douglas R., Mosca J. D., Moorman M. A., Simonetti D. W., Craig S., Marshak D. R. (1999) Science 284, 143–147 - PubMed
-
- Malaval L., Modrowski D., Gupta A. K., Aubin J. E. (1994) J. Cell. Physiol. 158, 555–572 - PubMed
Publication types
MeSH terms
Substances
LinkOut - more resources
Full Text Sources
Other Literature Sources
