. 2009 Sep;5(9):e1000650.
doi: 10.1371/journal.pgen.1000650. Epub 2009 Sep 18.

Multiple organ system defects and transcriptional dysregulation in the Nipbl(+/-) mouse, a model of Cornelia de Lange Syndrome

Affiliations

Multiple organ system defects and transcriptional dysregulation in the Nipbl(+/-) mouse, a model of Cornelia de Lange Syndrome

Shimako Kawauchi et al. PLoS Genet. 2009 Sep.

Abstract

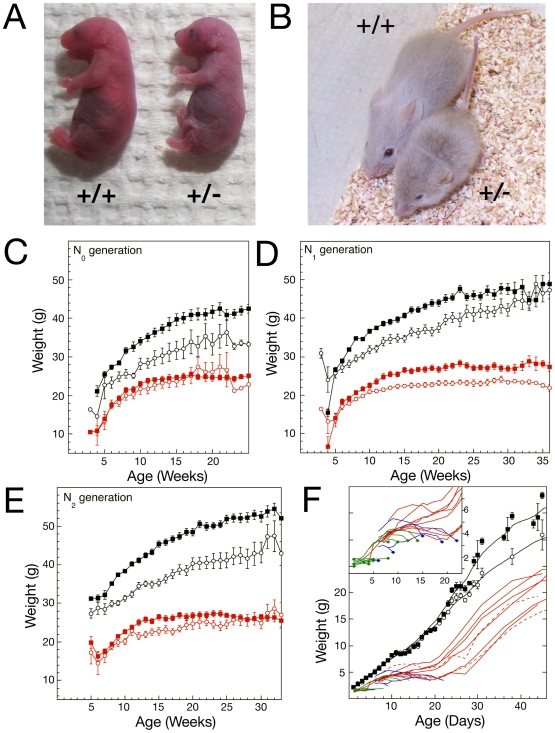
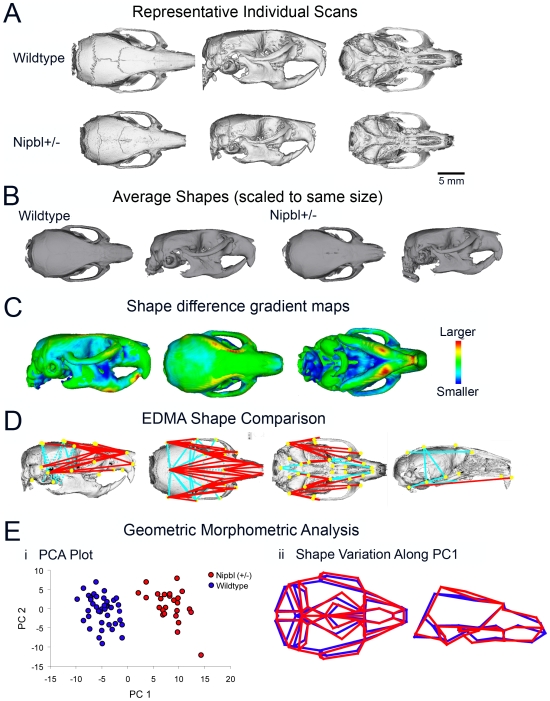
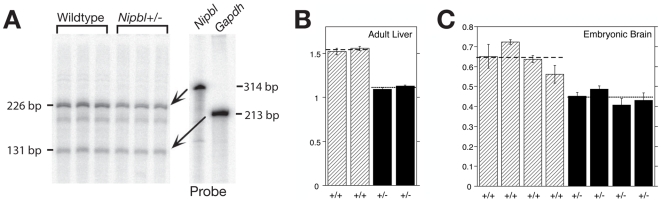
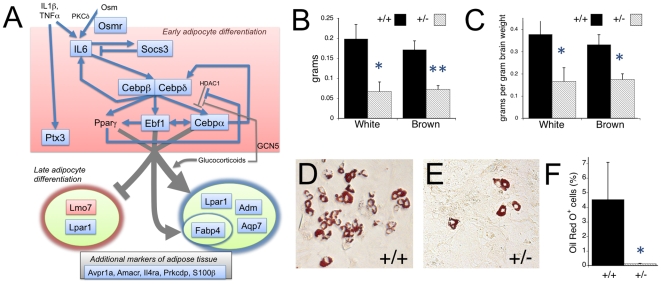
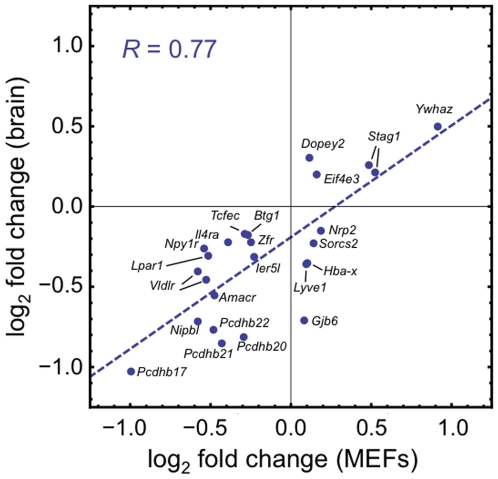
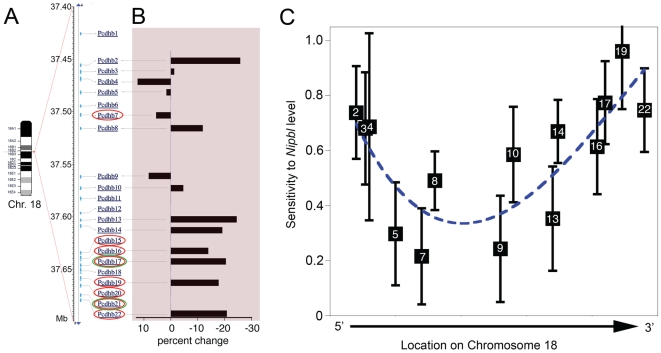
Cornelia de Lange Syndrome (CdLS) is a multi-organ system birth defects disorder linked, in at least half of cases, to heterozygous mutations in the NIPBL gene. In animals and fungi, orthologs of NIPBL regulate cohesin, a complex of proteins that is essential for chromosome cohesion and is also implicated in DNA repair and transcriptional regulation. Mice heterozygous for a gene-trap mutation in Nipbl were produced and exhibited defects characteristic of CdLS, including small size, craniofacial anomalies, microbrachycephaly, heart defects, hearing abnormalities, delayed bone maturation, reduced body fat, behavioral disturbances, and high mortality (75-80%) during the first weeks of life. These phenotypes arose despite a decrease in Nipbl transcript levels of only approximately 30%, implying extreme sensitivity of development to small changes in Nipbl activity. Gene expression profiling demonstrated that Nipbl deficiency leads to modest but significant transcriptional dysregulation of many genes. Expression changes at the protocadherin beta (Pcdhb) locus, as well as at other loci, support the view that NIPBL influences long-range chromosomal regulatory interactions. In addition, evidence is presented that reduced expression of genes involved in adipogenic differentiation may underlie the low amounts of body fat observed both in Nipbl+/- mice and in individuals with CdLS.


Conflict of interest statement

The authors have declared that no competing interests exist.

Figures

Figure 1
Figure 1. Abnormalities of bone and heart development in Nipbl+/− mice.
(A,B) Cranial and trunk skeleton at E17.5, stained with alcian blue/alizarin red (blue staining shows cartilage; red shows bone). (A) Wildtype and (B) Nipbl+/−. Arrows indicate locations at which ossification is delayed in the mutant. (C) Forepaws at E16.5. Skeletal elements are patterned normally in the mutant, but are smaller. (D) Forepaws at E18.5. Delayed ossification is readily seen in mutant metacarpals and phalanges. Scale bars in (A–D) = 2 mm. (E) Long bone length and degree of ossification at E18.5. For each bone, wildtype measurements are shown in the left bar, mutant in the right. The filled portion of each bar depicts the ossified fraction of the bone. Data are averaged independent measurements in each case (N = 14 for most measurements, with the exception of wildtype scapula [N = 9], Nipbl+/− scapula [N = 13], and Nipbl+/− femur [N = 11]). In mutant animals, long bones are ∼10% shorter than wildtype, and the degree of ossification is decreased by 5–7%. (F,G) Elbow joints of representative wildtype (F) and mutant (G) embryos at E18.5. The olecranon process (arrow) is longer and more pointed in the mutant. (H–K) Defects in cardiac septum formation. The developing atrial septum primum and septum secundum are readily apparent in wildtype heart at E15.5 [(H), arrow] but reduced in Nipbl+/− embryos at the same age (I). At E17.5, a well-formed atrial septum is apparent in wildtype [(J), arrow], but absent in many mutants (K). Scale bars in (G,I,K) = 1 mm.
Figure 2
Figure 2. Growth of Nipbl+/− mice.
(A,B) Photographs of pairs of newborn (A) and 4 week old (B) wildtype and Nipbl+/− littermates, illustrating obvious growth retardation. (C–E) Growth curves for N0 (C), N1 (D), and N2 (E) generations, starting at weaning age. Data are pooled by genotype and sex (N0 wildtype: 15 males and 7 females; N0 Nipbl+/− : 12 males and 7 females; N1 wildtype 39 males and 28 females; N1 Nipbl+/−: 23 males and 17 females; N2 wildtype: 72 males and 38 females, N2 Nipbl+/−: 39 males and 23 females): filled squares = male, open circles = female; red symbols = Nipbl+/−, black symbols = wildtype; error bars = SEM. Mutant mice of both sexes are smaller, and exhibit less weight gain after maturity. (F) Growth from birth through 6 weeks. Wildtype data (black symbols and lines) are pooled by sex: filled squares = male, open circles = female (data from 28 females and 26 males. error bars = SEM). The records of individual Nipbl+/− mice (N2 and N3 generation) are shown as connected lines without symbols. Red lines represent individual animals that survived at least 6 weeks (dashed = female; solid = male). Blue lines are Nipbl+/− mice that died before weaning. Green lines represent additional mice that died before weaning for which genotype could not be established (due to cannibalism or tissue decomposition). The inset magnifies the pre-weaning interval (1 to 22 days). Whereas wildtype mice grow at a nearly linear rate during the first two weeks of life, the data show that growth of most mutant mice arrests between postnatal days 5 and 15, followed, in about a third of cases, by death several days later. Several of the mutants that stopped growing and lost weight after day 12, however, were able to resume rapid weight gain immediately after weaning.
Figure 3
Figure 3. Craniofacial alterations.
Morphometric analysis of craniofacial morphology was based on micro-CT scans of 23 mutant and 40 wildtype mice (N0 and N1 generation; mixed sexes, ages 218–373 days). (A) Representative reconstructions of wildtype and mutant skulls. From left to right, dorsal, lateral, and ventral views are shown. (B) Average shapes for both genotypes, obtained as described by , using the entire sample of scans. (C) Shape distance map , showing the distribution of shape effects of the mutation. (D) Results of Euclidean Distance Matrix Shape analysis. This analysis compares the entire set of linear distances between landmarks to identify local differences in form. The two groups are significantly different in shape by a Monte Carlo randomization test (p<0.001). Distances shown are those that differ >5% between groups. Red lines are distances that are relatively smaller in the mutant; blue lines are those that are relatively larger. (E) Results of geometric morphometric analysis (Procrustes superimposed) of craniofacial shape. In this form of analysis, the 3D landmarks representing each individual are scaled to remove size and then superimposed using a translation and rotation step. This yields a dataset in which the differences in landmark position reflect differences in shape independently of size. (i) Principal components analysis can be used to visualize the variation in such a dataset, by transforming a set of correlated variables into a new set of uncorrelated ones, each representing successively smaller portions of the total sample variance. (ii) Variation along a principal component can be represented as a deformation of a wireframe drawn using the landmarks. The first principal component (PC1) distinguishes mutants from wildtypes. The two groups are also significantly different in shape by Goodall's F-test and MANOVA (p<0.001). The first principal component for the combined sample captures the shape variation that distinguishes the groups. The left panel indicates dorsal view of the wireframe and the right indicates lateral view. Blue = wildtype, red = Nipbl+/−.
Figure 4
Figure 4. Neuroanatomical, ophthalmic, and auditory phenotypes.
(A) Measurements from micro-CT analysis (Figure 3) reveal a 25% reduction in endocranial volume in Nipbl+/− mice (data are means±SD from 40 wildtype and 23 mutant skulls). (B) Nissl-stained coronal sections of adult wildtype (+/+) and Nipbl+/− brains illustrate reduced brain size, but grossly normal neuroanatomy. MHb, medial habenular nucleus; fr, fasiculus retroflexus; mt, mammillothalamic tract; dg, dentate gyrus; cc, corpus callosum. Scale bar: 1 mm. (C) Cerebellar hypoplasia in Nipbl+/− mice. Cresyl violet-stained midsagittal sections through the cerebellum of adult wildtype and Nipbl+/− mice. Mutant cerebella are smaller overall, with a less well-developed folium IX (bracket); note the subfolium (arrow in +/+) that was missing in 100% of analyzed mutants (asterisk; N = 3 Nipbl+/− and 3 wildtype littermate controls assessed). Reduction in the size of folium I was also commonly observed in mutants (not shown). Scale bar: 500 µm. (D,E) Corneal pathology in Nipbl+/− mice. (D) External view of wildtype and Nipbl+/− eyes, demonstrating central opacity (green arrowhead) and swelling/inflammation in the periorbital area (arrows) in the mutant. (E) Sections through wildtype and Nipbl+/− eyes, demonstrating disruption of corneal structure in the mutant, including infiltration of cells into the stroma and loss of epithelium. Ocular opacification was observed in 14% (24/173) of post-weaning animals tested. Scale bar: 100 µm. (F,G) Hearing deficits in Nipbl+/− mice. (F) Auditory brainstem evoked response (ABR) records for a pair of wildtype and Nipbl+/− littermates, performed as described . Stacked curves are responses to successive 10 dB increments of a pure-tone stimulus, and display five characteristic peaks of differing latency. In the Nipbl+/− curves, hearing loss is indicated by the much higher response threshold (this is seen in less than half of mutants). (G) Average background-subtracted sizes of Peaks II, III, and IV (normalized to Peak I to correct for experimental variation due to differences in electrode placement) for the 90 dB tone response of 6 wildtype and 6 mutant animals. Mutants show marked depression of peak III (P<0.02, ANOVA), consistent with abnormalities at the level of the auditory nerve or brainstem.
Figure 5
Figure 5. Nipbl transcript levels are reduced 25–30% in Nipbl+/− mice.
(A) Autoradiograms showing Nipbl and Gapdh probes, and protected fragments of 226 (representing Nipbl exons 11 and parts of exons 10 and 12) and 131 bases (Gapdh), respectively. RNA was prepared from livers of two female littermates (N0 generation; age = 119 days). The minor protected band at ∼185 bp (corresponding to the size of exon 11) most likely arises from the presence of unspliced or alternatively spliced mRNA. (B,C) Quantification of Nipbl/Gapdh ratios, from autoradiograms such as in (A), for adult female liver [(B); age = 73 days], and E17.5 brain (C). Mice in each panel are littermates. Hatched bars = wildtype, filled bars = Nipbl+/−. Error bars = SD for triplicate (B) or quadruplicate (C) measurements.
Figure 6
Figure 6. Alterations in adipogenesis in Nipbl+/− mice.
(A) Gene regulatory network underlying adipogenesis. The adipogenic conversion of pre-adipogenic mesenchyme is under the control of a network of cross-regulating transcription factors, notably C/EBPβ, C/EBPα, C/EBPδ, PPARγ, and Ebf1 ,,. Input into this pathway can come from adipogenesis-promoting growth factors, such as interleukin 6 (IL6), or pharmacological agents such as glucocorticoids and PPARγ agonists ,. A variety of other downstream genes have been identified as markers of early and late adipogenesis. Genes that were observed to be down-regulated in Nipbl+/− MEFs are highlighted in blue; those up-regulated are highlighted in pink. (B,C) Nipbl+/− mice are depleted in both white and brown fat. Scapular fat pads were dissected from adult male mice (206–630 days postnatal), divided into brown and white portions, and weighed (B). In (C), these weights have been normalized to brain weight, to correct for overall body size differences between wildtype (N = 11) and mutant (N = 9) mice. Both panels indicate that Nipbl+/− mice are substantially depleted in fat. (* = P<0.05, ** = P<0.01, Student's t-test). (D–F) Reduced spontaneous adipogenesis in Nipbl+/− MEFs. To determine whether mutant mesenchymal cells are intrinsically defective in adipogenic differentiation, wildtype (D) and Nipbl+/− (E) MEFs were cultured at confluence for 8 days, which allows for spontaneous adipocyte differentiation by a fraction of the cells, and fat-accumulating cells were visualized by Oil Red O staining. (F) summarizes data on the fraction of Oil Red O-positive cells observed in 9 independent MEF lines (>21,000 cells counted per line), from 4 wildtype and 5 Nipbl+/− mice (P<0.05, Mann-Whitney Rank-Sum test).
Figure 7
Figure 7. Gene expression effects are correlated across cell/tissue types.
Comparison of gene expression profiles of E13.5 brain and MEFs (cf. Table S2 and Table S3, respectively) identified 25 probe sets for which differential expression between wildtype and Nipbl+/− samples displayed a t-statistic with an absolute value >2 in both brain and MEFs. For each such probe set, the log2-transformed expression change in MEFs was plotted against the log2-transformed expression change in brain. Points are labeled by gene symbol. The observed correlation (correlation coefficient = 0.77) indicates that, for those transcripts affected in both mutant brain and mutant MEFs, the directions and magnitudes of the expression changes are often similar. This suggests that such transcripts may be “direct” targets of NIPBL. Note the presence of Stag1, which encodes a cohesin subunit.
Figure 8
Figure 8. Position-specific effects on beta protocadherin (Pcdhb) expression.
(A) The protocadherin beta (Pcdhb) locus consists of 22 tandemly-oriented, single-exon genes distributed over ∼250 kb of chromosome 18. The names of genes that displayed significant reductions in expression in microarray analyses of Nipbl+/− E13.5 brain, and Nipbl+/− MEFs, are circled in red, and green, respectively. (B) Quantitative RT-PCR was used to measure the levels of 14 Pcdhb transcripts in RNA from E17.5 wildtype and Nipbl+/− brain. Data are averages from 6 wildtype and 7 mutant samples, presented as percent change from wildtype. (C) Sensitivities of gene expression to Nipbl level. Quantitative RT-PCR results for the Pcdhb transcripts in (B) were correlated with the levels of Nipbl in each mutant and wildtype sample to produce a best-fit regression line that estimates the fold-change in Pcdhb transcript per fold-change in Nipbl. Error bars representing the standard error of this estimate were obtained from the 67% confidence intervals for the slopes of the regression lines (roughly equivalent to one standard deviation; see Figure S4 for details). Sensitivities and error bars were plotted on an abscissa corresponding to the location of the transcriptional start sites of each of the Pcdhb genes. The dashed line is a smooth polynomial fit to the data. Note that a sensitivity of unity simply means that a Pcdhb transcript level varies linearly with Nipbl levels, whereas a sensitivity of 0.2 means it varies with the 1/5th power of Nipbl levels (i.e. very weakly). The data imply that sensitivity is high at both ends of the Pcdhb cluster, falling to much lower levels in the middle.

Similar articles

Cited by

References

    1. de Lange C. Sur un type nouveau de degeneration (typus Amstelodamensis). Arch Med Enfants. 1933;36:713–719.
    1. Jackson L, Kline AD, Barr MA, Koch S. de Lange syndrome: a clinical review of 310 individuals. Am J Med Genet. 1993;47:940–946. - PubMed
    1. Ireland M, Donnai D, Burn J. Brachmann-de Lange syndrome. Delineation of the clinical phenotype. Am J Med Genet. 1993;47:959–964. - PubMed
    1. Braddock SR, Lachman RS, Stoppenhagen CC, Carey JC, Ireland M, et al. Radiological features in Brachmann-de Lange syndrome. Am J Med Genet. 1993;47:1006–1013. - PubMed
    1. Mehta AV, Ambalavanan SK. Occurrence of congenital heart disease in children with Brachmann-de Lange syndrome. Am J Med Genet. 1997;71:434–435. - PubMed

Publication types

MeSH terms