

Review
doi: 10.1007/s10384-009-0688-1.
Epub 2009 Sep 8.
Magnetic resonance imaging of the retina
Affiliations
- PMID: 19763752
- PMCID: PMC2901235
- DOI: 10.1007/s10384-009-0688-1
Item in Clipboard
Review
Magnetic resonance imaging of the retina
Jpn J Ophthalmol.
2009 Jul.
Abstract
This paper reviews recent developments in high-resolution magnetic resonance imaging (MRI) and its application to image anatomy, physiology, and function in the retina of animals. It describes technical issues and solutions in performing retinal MRI, anatomical MRI, blood oxygenation level-dependent functional MRI (fMRI), and blood-flow MRI both of normal retinas and of retinal degeneration. MRI offers unique advantages over existing retinal imaging techniques, including the ability to image multiple layers without depth limitation and to provide multiple clinically relevant data in a single setting. Retinal MRI has the potential to complement existing retinal imaging techniques.
Figures
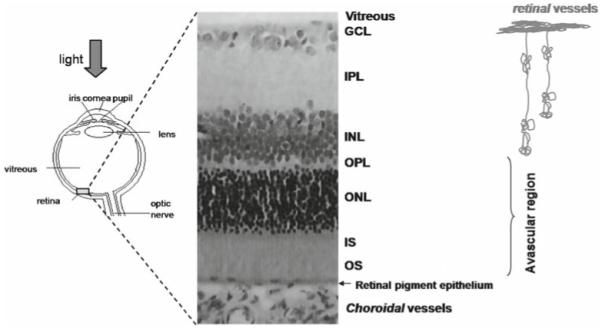
Schematic drawing of the eye and histology of a rodent retina. The retina consists of multiple well-defined layers.- Starting from the vitreous boundary, they include the ganglion cell layer (GCL), inner plexiform layer (IPL), inner nuclear layer (INL), outer plexiform layer (OPL), outer nuclear layer (ONL), and photoreceptor inner (IS) and outer segments (OS). The retina is nourished by two separate blood supplies, the retinal and choroidal circulations. The retinal vessels are within the GCL, INL, IPL, and OPL. The choroidal vessels are located posterior to the photoreceptor layer. The outer nuclear layer and the inner and outer segments are avascular. Adapted from Fig. 1 of Shen et al., J Magn Reson Imaging.
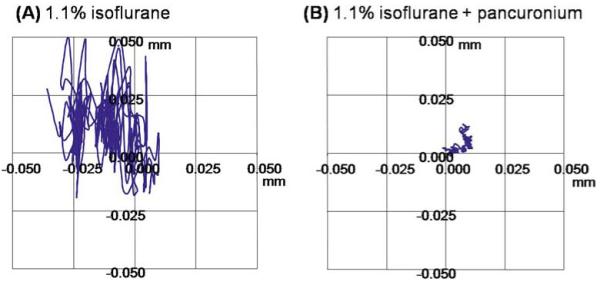
A, B. Optical imaging of the corneal surface. Optical images were acquired at 7 × 7 μm on an animal under 1.1% isoflurane without (A) and with (B) pancuronium bromide paralytic. The traces show the in-plane displacement of a marker on the corneal surface over 4 min for both experimental conditions. Adapted from figures in Duong et al., J Magn Reson Imaging and Zhang et al., Proc Magn Reson Med.
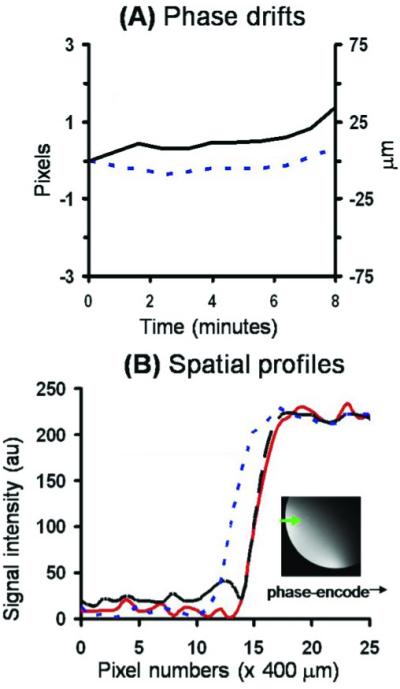
A, B. Magnetic resonance imaging (MRI) of a phantom by conventional gradient-echo MRI at 25 × 25 μm. A Temporal-phase evolution in the readout (------) and phase-encode (—) direction of the entire image. B Image intensity profile of the first (– – –) and last (------) original images, and the last image after phase correction (—). The profiles were obtained across the phantom in the phase-encoding direction as shown in the inset. Adapted from figures in Duong et al., J Magn Reson Imaging and Zhang et al., Proc Magn Reson Med.
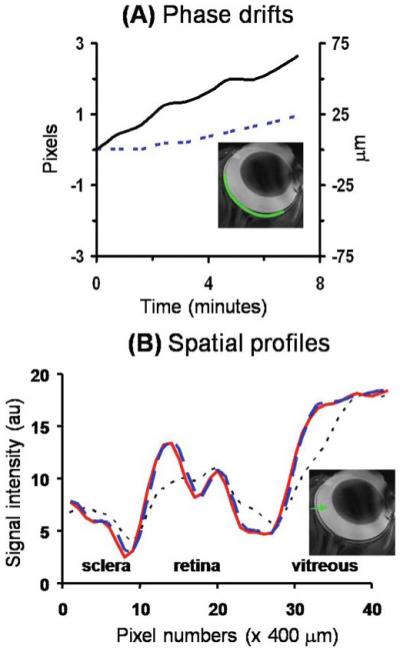
A, B. In vivo MRI by conventional gradient-echo MRI at 25 × 25 μm. A Temporal-phase evolution in the readout (------) and phase-encode (—) direction of the entire retina obtained from an anesthetized and paralyzed animal using conventional gradient-echo acquisition at 25 × 25 μm. B Image intensity profiles of the in vivo original data (------), after coregistration (– – –), and after phase correction (—) from an in vivo retina. The image profiles were obtained across the retinal thickness from the sclera to the vitreous as shown in the inset. Adapted from figures in Duong et al., J Magn Reson Imaging and Zhang et al., Proc Magn Reson Med.
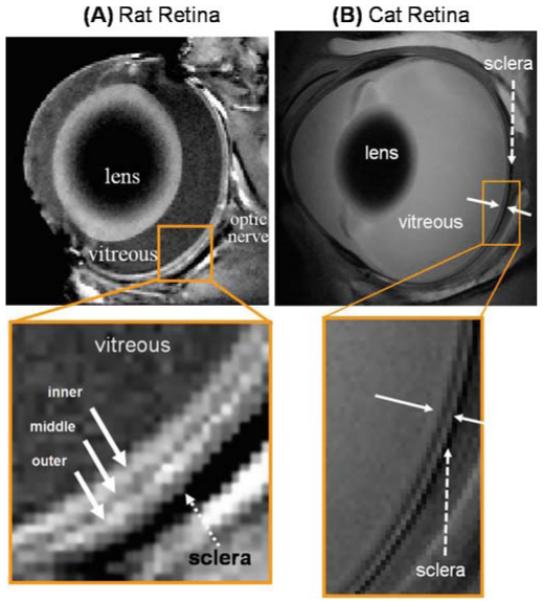
A, B. Anatomical MRI of rat and cat retina. A Anatomical images from a normal Sprague-Dawley adult rat retina at 60 × 60 × 500 μm. Three distinct layers (solid arrows) of alternating bright, dark and bright bands are evident. The sclera (dashed arrow) is hypointense. Adapted from Fig. 1 of Cheng et al., Proc Natl Acad Sci USA. B Cross-sectional T2-weighted (TE = 40 ms) images from a normal cat retina at 100 × 100 × 1500 μm resolution. The solid white arrows indicate the inner and outer strips, respectively. The dashed arrow indicates the hypointense sclera. Adapted from Fig. 3 of Shen et al., J Magn Reson Imaging.
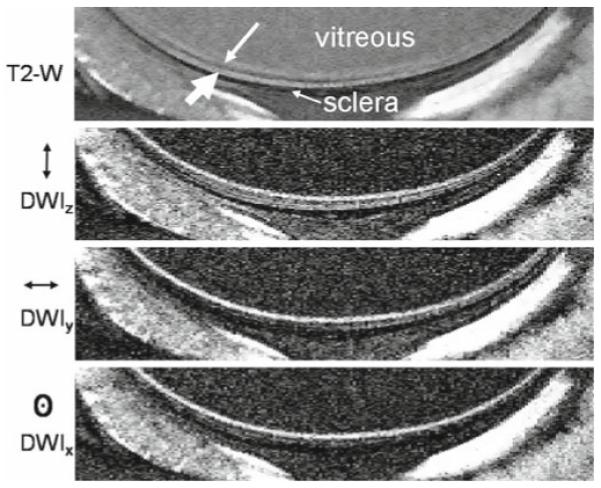
Diffusion-weighted MRI of the cat retina. T2-weighted (TE = 40 ms) and diffusion-weighted (b = 504 s/mm2) images at 50 × 100 × 1500 μm. Diffusion-sensitizing gradients were placed along the x, y, or z axis separately. The small and large white arrows indicate the inner and outer bands, respectively. Reproduced from Fig. 5 of Shen et al., J Magn Reson Imaging.
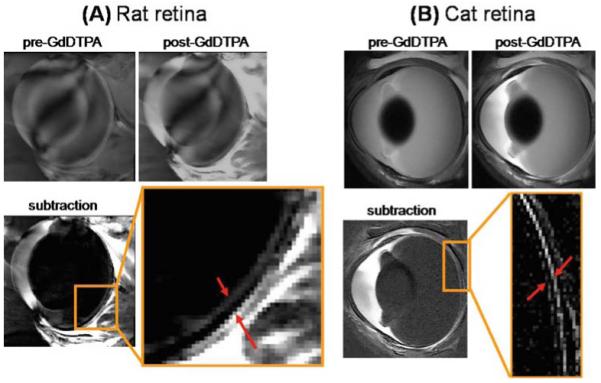
Gadolinium diethylenetriamine pentaacetic acid (GdDTPA)-enhanced MRI of the rat and cat retina. A Contrast-enhanced images from a normal Sprague-Dawley adult rat retina at 60 × 60 × 500 μm before and after GdDTPA administration and of the subtracted image. The two arrows in the expanded view indicate the inner and outer bands of the retina corresponding to the two vascular layers bounding the retina. Signal enhancement of extraocular tissues supplied by GdDTPA permeable vessels is also present. Adapted from Fig. 2 of Cheng et al., Proc Natl Acad Sci U S A. B Contrast-enhanced images from a normal adult cat retina at 100 × 100 × 1500 μm before and after GdDTPA administration and of the subtracted image. The two arrows in the expanded view indicate the inner and outer bands of the retina. Extraocular enhancement was also observed. Adapted from Fig. 6 of Shen et al., J Magn Reson Imaging.
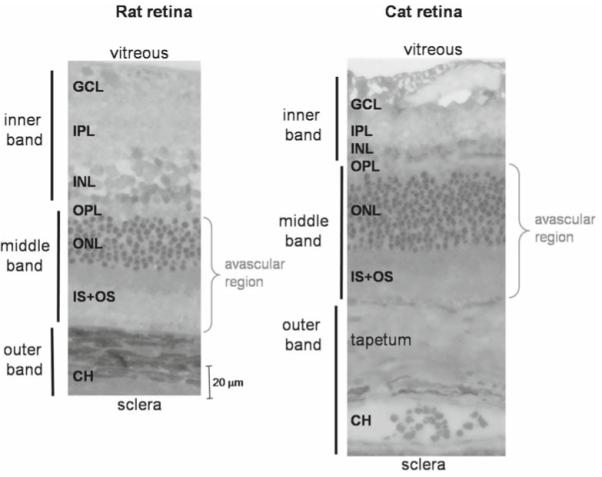
Histology of the rat and cat retinas. Histological section of a normal adult Sprague-Dawley rat and cat retina stained with toluidine blue. Three vertical bars on the left show the assignments of the three MRI-derived layers. CH, choroidal vascular layer. In the cat, there is an additional, vascularized layer known as the tapetum. The rat and cat histological slides are drawn approximately to scale. Adapted from Fig. 5 of Cheng et al, Proc Natl Acad Sci U S A, and Fig. 1 of Shen et al., J Magn Reson Imaging.
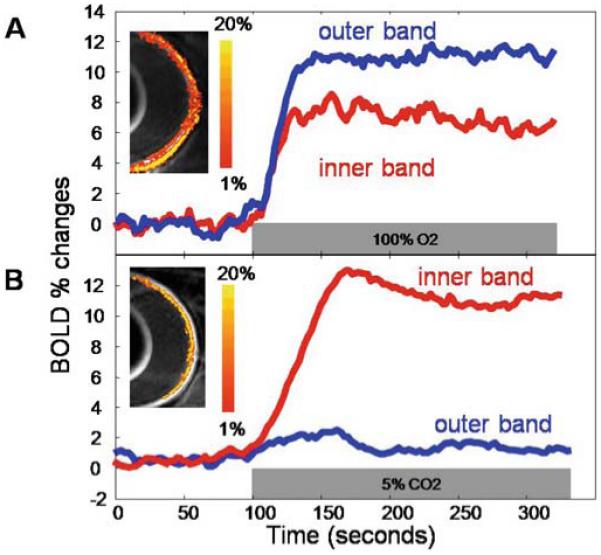
A, B. Blood oxygenation level-dependent (BOLD) functional MRI (fMRI) response of the retina. Lamina-specific BOLD fMRI responses to (A) hyperoxia (100% O2) and (B) hypercapnia (5% CO2 in air) from a normal rat at 90 × 90 × 1000 μm in-plane resolution. BOLD percent-change maps are overlaid on echo-planar images. The color bar indicates BOLD percent changes. Adapted from Fig. 6 of Cheng et al., Proc Natl Acad Sci U S A.
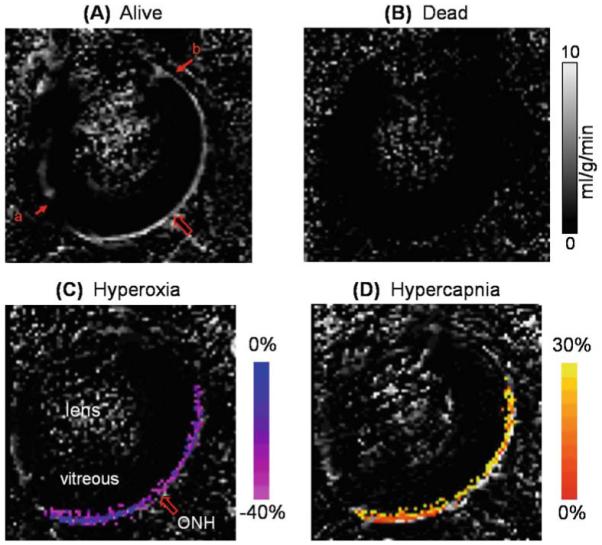
A–D. Blood-flow MRI of the retina. Quantitative basal blood-flow images were obtained at 90 × 90 × 1000 μm from a representative rat alive (A) and dead (B). Blood-flow values in the retina and the ciliary body are high, whereas blood flow in the lens and vitreous are within noise levels. The large arrow indicates the location of the optic nerve head (ONH). Blood-flow data were obtained from one distal edge (a) to the other (b). Blood-flow percent-change maps responding to physiologic stimuli, (C) 100% O2 or (D) 5% CO2, obtained from a representative animal. Percent changes are overlaid on blood-flow maps. Color bars indicate blood-flow percent changes. Blood-flow changes due to hyperoxia and hypercapnia were statistically significantly different from baseline (air) (P < 0.05). Adapted from Figs. 2 and 4 of Li et al., Neuroimage.
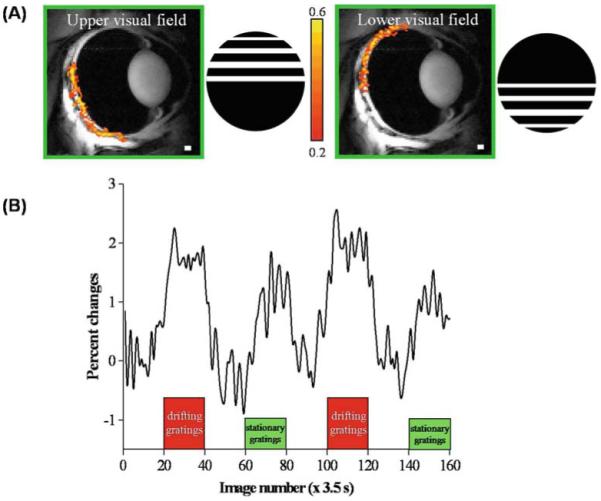
A, B. fMRI of visual stimulation of the cat retina. A fMRI maps (468 × 468 × 1000 μm) of the upper and lower visual field using drifting gratings versus dark. The gratings were a square wave with 0.15 cycles/deg and 2 cycles/s. The color bar indicates the cross-correlation coefficient. B fMRI signal modulation under dark, drifting gratings and stationary gratings (same luminance). Positive signal changes are observed under both drifting-grating and stationary-grating stimuli relative to the dark basal conditions. Signal changes due to the drifting gratings are approximately twice that of stationary gratings. Adapted from Figs. 3 and 4 of Duong et al., Invest Ophthalmol Vis Sci.
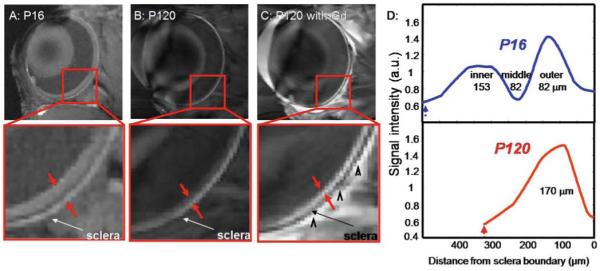
A–D. Anatomical MRI of retinal degeneration in the RCS rat retina. Anatomical images at 60 × 60 × 500 μm of (A) P16 RCS retina before photoreceptor degeneration, and degenerated P120 RCS retina before (B) and after (C) intravenous administration of Gd-DTPA. Red arrows delineate the inner and outer edges of the retina. Black arrowheads indicate signal enhancement of extraocular tissues. D Intensity profiles show thinning of the P120 compared to the P16 RCS retina. The dashed arrows indicate the vitreous boundaries. Adapted from Fig. 7 of Cheng et al., Proc Natl Acad Sci USA.
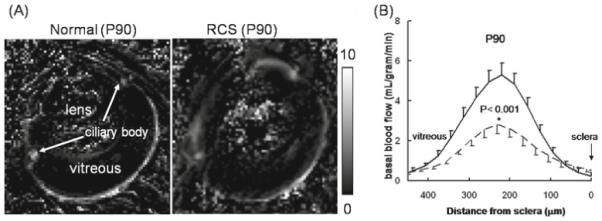
A, B. Blood-flow MRI of retinal degeneration in the RCS rat retina. A Blood-flow images from a normal retina and a RCS rat retina at postnatal day 90 (P90). B Their blood-flow profiles across the retinal thickness (mean ± SD, n = 5).—, normal rat;–––, RCS rat. The scale bar indicates blood-flow values in ml/g per minute. Note that the blood-flow profile of the RCS P90 rat retina was thinner than the normal retina. Adapted from Fig. 2 of Li et al., Invest Ophthalmol Vis Sci.
References
-
- Kaufman PL, Alm A, editors. Adler’s physiology of the eye. Mosby; St Louis: 1992.
-
- Bron AJ, Tripathi RC, Tripathi BJ. Wolff’s anatomy of the eye and orbit. Chapman & Hall Medical; London: 1997.
-
- Buttery RG, Hinrichsen CFL, Weller WL, Haight JR. How thick should a retina be? A comparative study of mammalian species with and without intraretinal vasculature. Vis Res. 1991;31:169–187. - PubMed
-
- Harris A, Kagemann L, Cioffi GA. Assessment of human ocular hemodynamics. Surv Ophthalmol. 1998;42:509–533. - PubMed
-
- Bill A. Circulation in the eye. In: Renkin EM, Michel CC, editors. Handbook of physiology, part 2, in microcirculation. American Physiological Society; Bethesda, MD: 1984. pp. 1001–1035.
Publication types
MeSH terms
Substances
Grants and funding
LinkOut - more resources
Full Text Sources
Medical
