. 2010 Feb 1;338(1):76-85.
doi: 10.1016/j.ydbio.2009.09.015. Epub 2009 Sep 18.

Cell death and tissue remodeling in planarian regeneration

Affiliations

Cell death and tissue remodeling in planarian regeneration

Jason Pellettieri et al. Dev Biol. .

Abstract

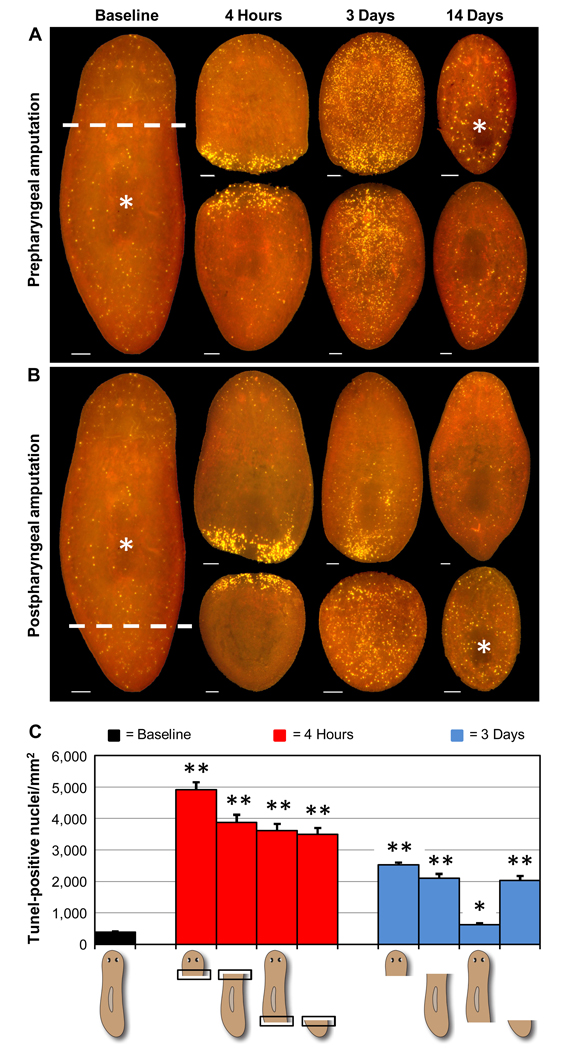
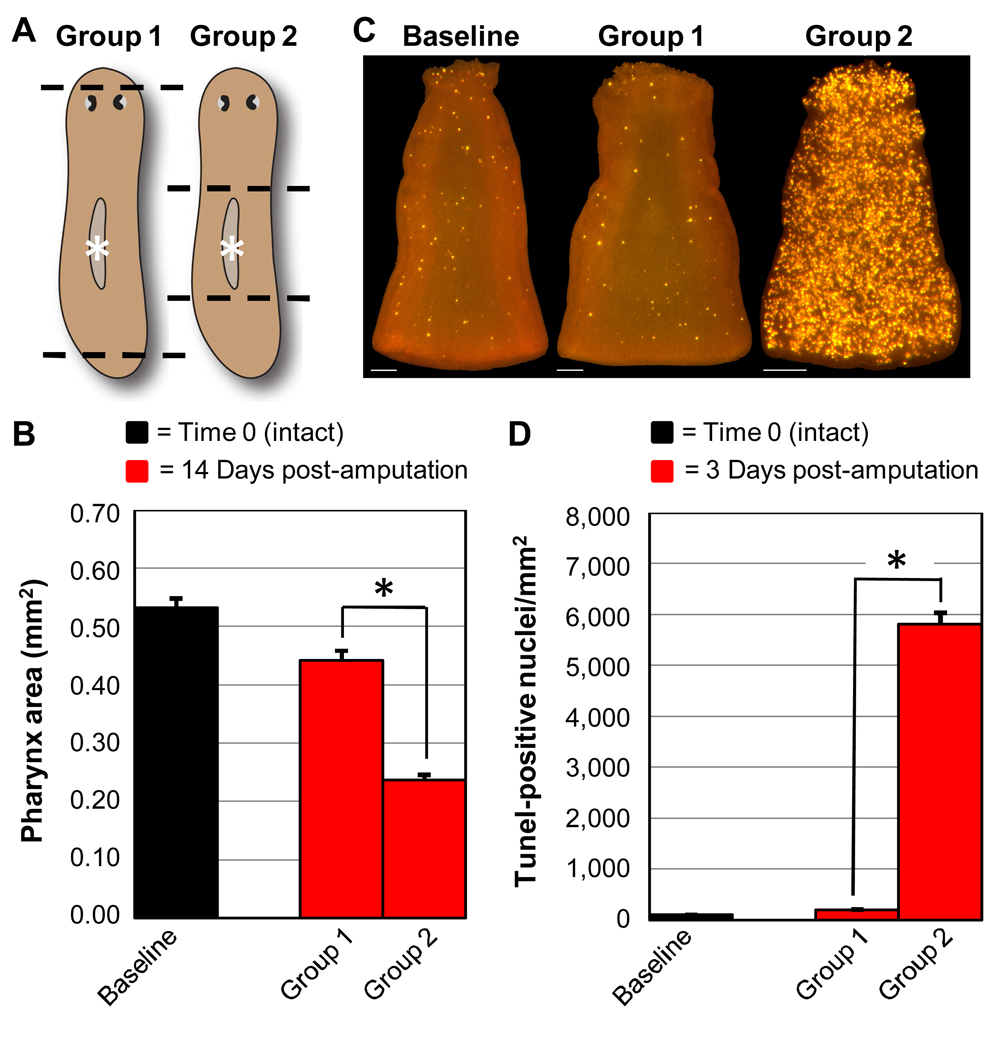
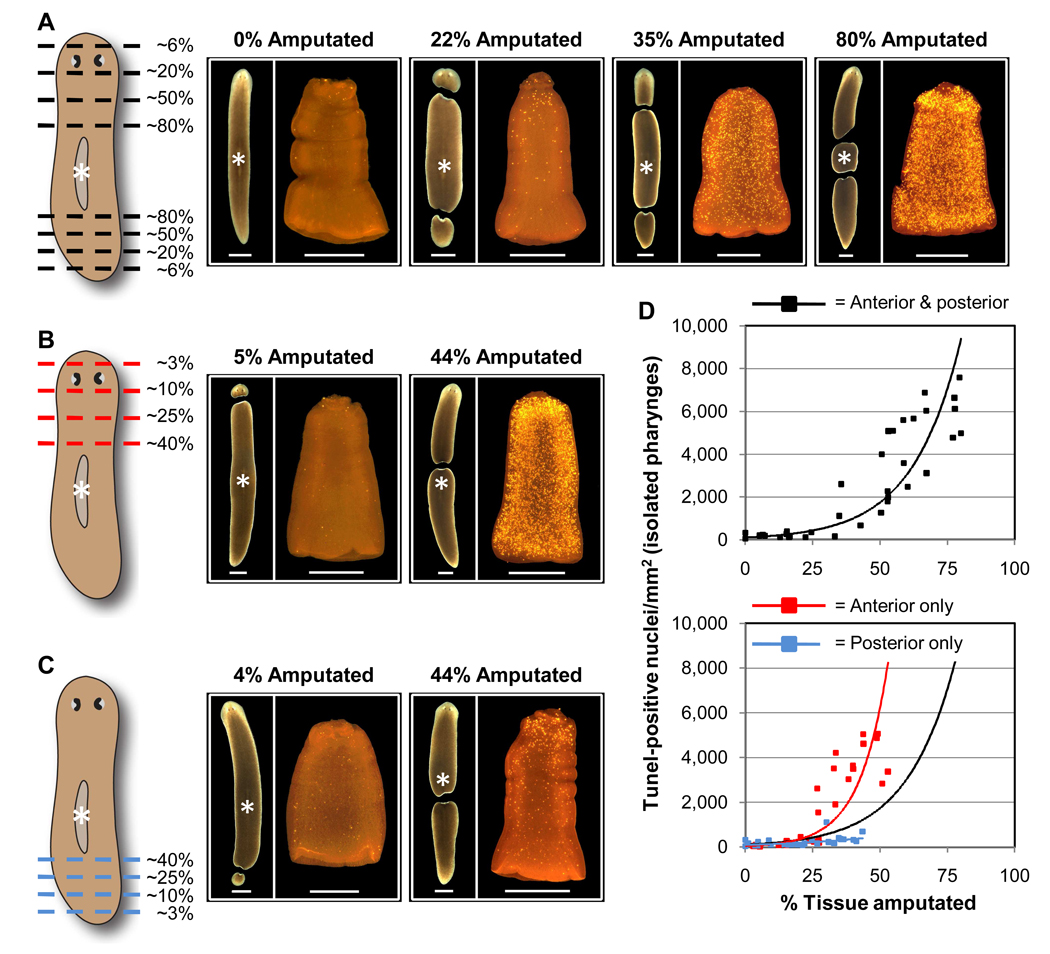
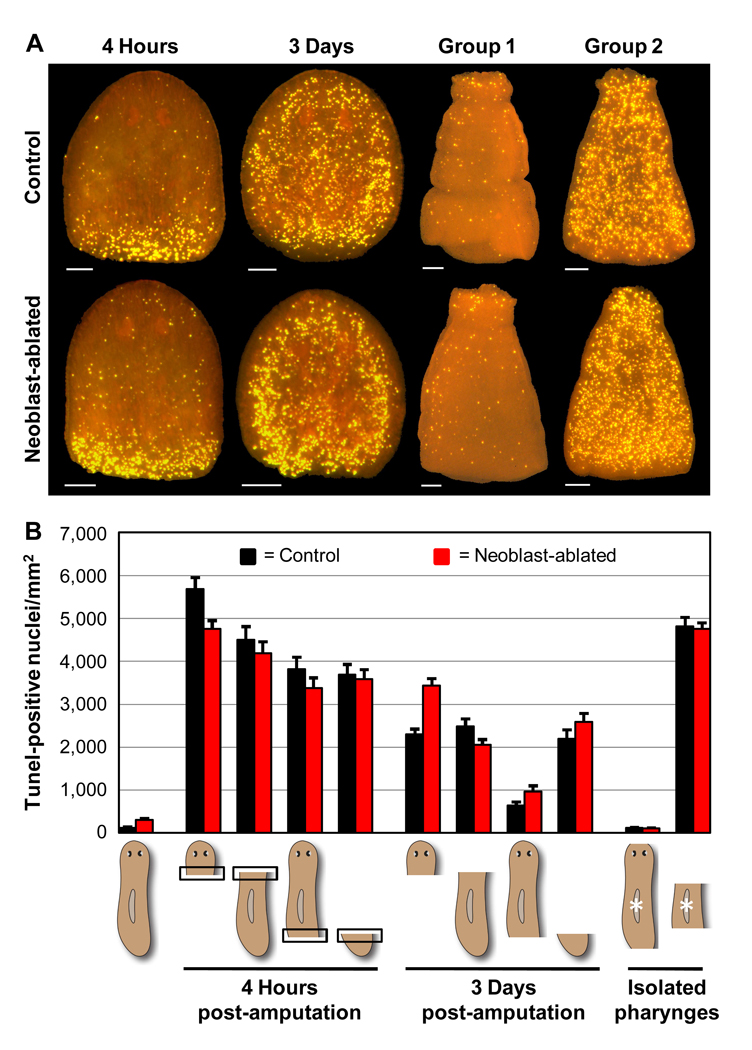
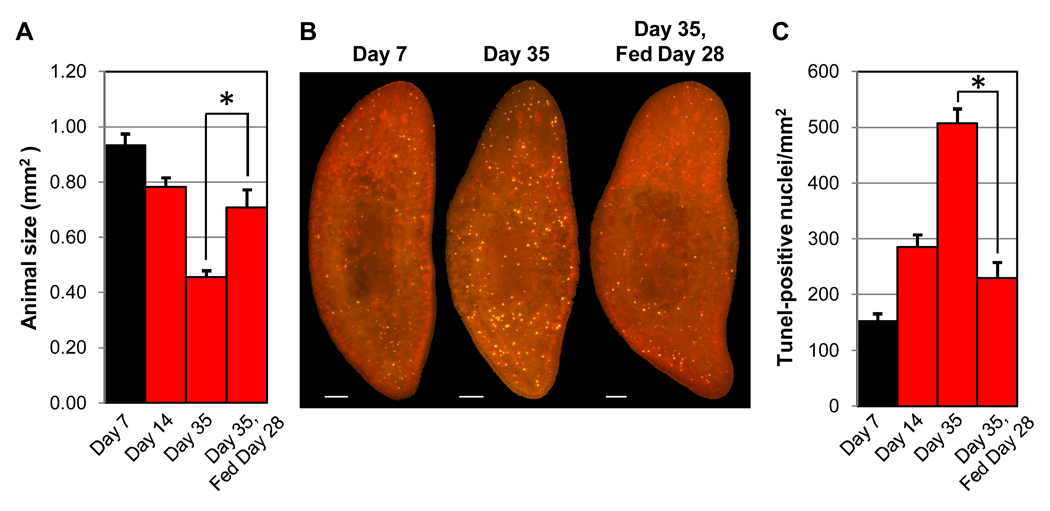
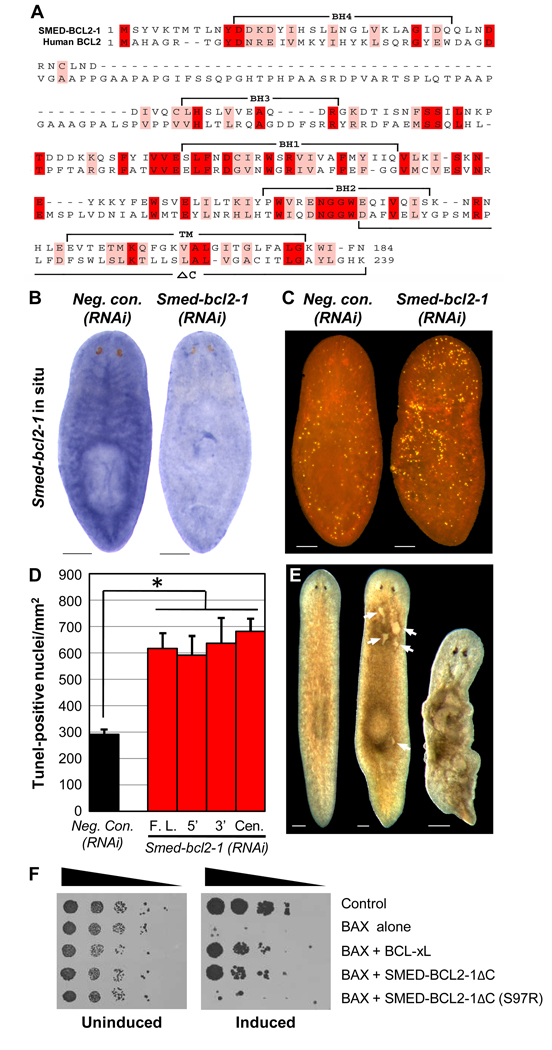
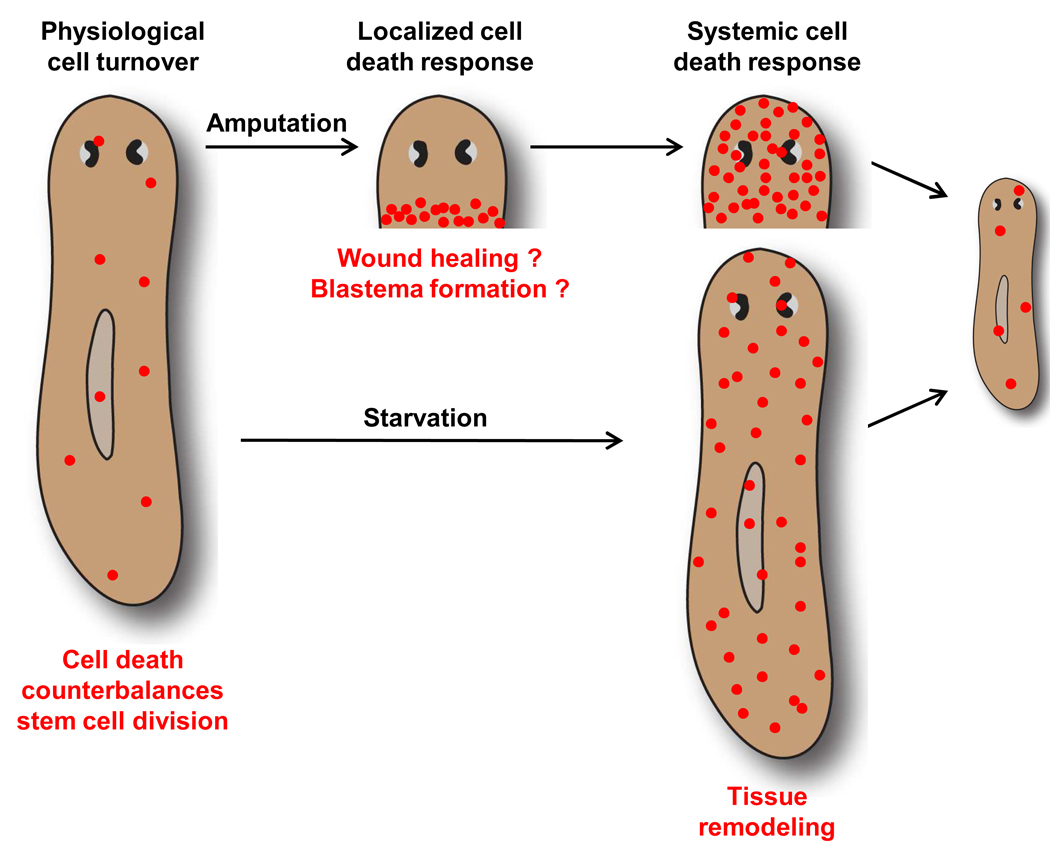
Many long-lived organisms, including humans, can regenerate some adult tissues lost to physical injury or disease. Much of the previous research on mechanisms of regeneration has focused on adult stem cells, which give rise to new tissue necessary for the replacement of missing body parts. Here we report that apoptosis of differentiated cells complements stem cell division during regeneration in the planarian Schmidtea mediterranea. Specifically, we developed a whole-mount TUNEL assay that allowed us to document two dramatic increases in the rate of apoptosis following amputation-an initial localized response near the wound site and a subsequent systemic response that varies in magnitude depending on the type of fragment examined. The latter cell death response can be induced in uninjured organs, occurs in the absence of planarian stem cells, and can also be triggered by prolonged starvation. Taken together, our results implicate apoptosis in the restoration of proper anatomical scale and proportion through remodeling of existing tissues. We also report results from initial mechanistic studies of apoptosis in planarians, which revealed that a S. mediterranea homolog of the antiapoptotic gene BCL2 is required for cell survival in adult animals. We propose that apoptosis is a central mechanism working in concert with stem cell division to restore anatomical form and function during metazoan regeneration.


Figures

Fig. 1
Fig. 1
Apoptosis in regenerating planarians. Animals were amputated as indicated (dashed white lines) at Time 0, prior to visualization of apoptosis by TUNEL. These and all subsequent TUNEL pictures show whole-mounted animals imaged in a single focal plane. (A, B) Representative results for prepharyngeal (A) or postpharyngeal (B) amputation. Asterisks denote the original position of the pharynx (left) and the newly regenerated pharynges in head and tail fragments (right). Scale bars = 100 µm. (C) Average TUNEL levels for 5 independent experiments (n ≥ 21 for each condition). Values for the 4-hour timepoint are restricted to the area within 100 µm of the amputation site (boxed areas in schematic diagrams). Error bars = +/− s.e.m. * = p value < 0.01 for two-tailed Student’s t-Test comparing regenerating fragments with intact controls. ** = p value < 1 × 10⁻¹⁰. See Supplementary Figure 2A for extended regeneration timecourses.
Fig. 2
Fig. 2
Induction of apoptosis during remodeling of an uninjured organ. (A) Animals were amputated as indicated (dashed lines) at Time 0 and anterior and posterior fragments were discarded. Pharynges (grey ovals marked by asterisks) were then isolated from the regenerating trunk fragments as well as intact control animals. (B) Average size of isolated pharynges at Time 0 (Baseline) and 14 days post-amputation (Group 1 and Group 2) for 3 independent experiments (n ≥ 35 for each condition). (C) Representative TUNEL staining patterns in isolated pharynges at Time 0 (Baseline) and 3 days post-amputation (Group 1 and Group 2). Scale bars = 100 µm. (D) Average TUNEL levels for 3 independent experiments (n ≥ 26 for each condition). In (B, D), error bars = +/− s.e.m. * = p value for two-tailed Student’s t-Test < 1 × 10⁻¹⁵.
Fig. 3
Fig. 3
Disproportionate induction of apoptosis by cephalic amputation. (A–C) Animals were amputated as indicated (dashed lines) at Time 0, with approximately equal amounts of both anterior and posterior tissue removed (A) or selective amputation of anterior (B) or posterior (C) tissues. Each fragment was photographed (left of each panel; scale bars = 1 mm) and the total amount of tissue removed was determined from measurements of fragment areas. At 3 days post-amputation, pharynges (marked by white asterisks) were isolated from the regenerating trunk fragments and stained by TUNEL (right of each panel; scale bars = 0.5 mm). (D) The total percentage of tissue removed was plotted against TUNEL levels in the pharynx. Scatter plots show results for animals amputated both anterior and posterior to the pharynx (top) vs. only anterior or posterior to the pharynx (bottom). Each data point shows the value for a single animal tested in 1 of 3 independent experiments (n ≥ 26 for each condition). Exponential trendlines (color coded to match the schematic diagrams) are included. The trendline for anterior plus posterior amputation (black) is included in the lower graph for comparison.
Fig. 4
Fig. 4
Amputation-induced apoptosis is stem cell-independent. Control and neoblast-ablated (irradiated) animals (Materials and methods) were amputated as described in Figure 1 and Figure 2. (A) Representative TUNEL patterns in head fragments (left) or pharynges isolated from regenerating trunk fragments (right). Head fragments were fixed at 4 hours or 3 days post-amputation. All pharynges were isolated and fixed at 3 days post-amputation. Scale bars = 100 µm. (B) Average TUNEL levels for 3 independent experiments (n ≥ 17 for each condition). Values for the 4-hour timepoint are restricted to the area within 100 µm of the amputation site (boxed areas in schematic diagrams). Error bars = +/− s.e.m. p values for two-tailed Student’s t-Tests comparing paired control and irradiated regenerating animals were all > 0.05, except for prepharyngeal anterior fragments. p values for comparisons of regenerating animals with their respective intact controls (or Group 1 vs. Group 2 for isolated pharynges) were all < 1 × 10⁻³.
Fig. 5
Fig. 5
Apoptosis increases during degrowth. Size-matched adult animals were fed at Time 0, prior to fixation at 7, 14, or 35 days post-feeding. After 28 days of starvation, a subset of the remaining animals was administered a single feeding and fixed on Day 35. (A) Average animal size for 3 independent experiments (n ≥ 31 for each timepoint). (B) Representative TUNEL results. Scale bars = 100 µm. (C) Average TUNEL levels. In (A, C), error bars = +/− s.e.m. * = p value for two-tailed Student’s t-Test < 1 × 10⁻³.
Fig. 6
Fig. 6
A S. mediterranea homolog of BCL2. (A) Alignment of SMED-BCL2-1 predicted protein sequence (GenBank accession no. FJ807655) with human BCL2 protein sequence (GenBank accession no. NM_000633) generated with Expresso (Armougom et al., 2006). Identical residues are shaded red and conserved residues are shaded pink. The 4 BCL2-Homology (BH) domains, transmembrane region (TM), and C-terminal region deleted in SMED-BCL2-1ΔC (ΔC) are indicated. (B) Smed-bcl2-1 expression pattern visualized by in situ hybridization. Representative animals from 2 independent experiments (n ≥ 12 for each condition) are shown. Scale bars = 200 µm. (C) Smed-bcl2-1(RNAi) animals exhibited elevated TUNEL staining. Scale bars = 100 µm. (D) Average TUNEL levels for 3 independent experiments (n ≥ 21 for each condition). RNAi constructs generated dsRNA corresponding to the full-length ORF (F.L.) or nonoverlapping regions at the 5’, 3’, and central parts of the ORF. Error bars = +/− s.e.m. * = p value for two-tailed Student’s t-Test < 1 × 10⁻³. (E) > 90% of Smed-bcl2-1(RNAi) animals (n > 100) developed tissue lesions on their dorsal surface (middle, arrows) and went on to exhibit atrophy and lysis (right), as compared to 0% of Negative control(RNAi) animals (n > 100). Scale bars = 200 µm. Results in (C, D) are for animals analyzed prior to the appearance of lesions. (F) S. cerevisiae was transformed with the indicated constructs (empty vector used for controls) and plated in serial dilution (left to right in each panel). Induced expression of murine BAX (right) is lethal. This effect was rescued by human BCL-xL or SMED-BCL2-1ΔC, and was abrogated by mutation of SMED-BCL2-1ΔC Ser97 to Arg (S97R).
Fig. 7
Fig. 7
Model of apoptosis functions in planarian tissue remodeling. Amputation leads to 2 distinct waves of apoptosis (red circles) in regenerating fragments. The initial localized increase in cell death at 1 to 4 hours post-amputation might promote wound healing and/or blastema formation. We propose that the later systemic increase in cell death represents a key component of the tissue remodeling process that restores scale and proportion and integrates new and preexisting tissues. In this case, remodeling results in a reduction in the size of the photoreceptors, lengthening and narrowing of the entire animal, and integration of the newly formed pharynx. The systemic cell death response is also induced in intact animals by prolonged starvation, contributing to a reduction in the animal’s overall size.

References

    1. Armougom F, Moretti S, Poirot O, Audic S, Dumas P, Schaeli B, Keduas V, Notredame C. Expresso: automatic incorporation of structural information in multiple sequence alignments using 3D-Coffee. Nucleic Acids Res. 2006;34:W604–W608. - PMC - PubMed
    1. Baguñà J. Mitosis in the intact and regenerating planarian Dugesia mediterranea n.sp. I. Mitotic studies during growth, feeding and starvation. J. Exp. Zool. 1976a;195:53–64.
    1. Baguñà J. Mitosis in the intact and regenerating planarian Dugesia mediterranea n.sp. II. Mitotic studies during regeneration, and a possible mechanism of blastema formation. J. Exp. Zool. 1976b;195:65–80.
    1. Baguñà J, Romero R. Quantitative analysis of cell types during growth, degrowth and regeneration in the planarians Dugesia mediterranea and Dugesia tigrina. Hydrobiologia. 1981;84:181–194.
    1. Ballarin L, Burighel P, Cima F. A tale of death and life: natural apoptosis in the colonial ascidian Botryllus schlosseri (Urochordata, Ascidiacea) Curr. Pharm. Des. 2008;14:138–147. - PubMed

Publication types

MeSH terms

Substances