. 2009 Nov 20;284(47):32507-21.
doi: 10.1074/jbc.M109.050401. Epub 2009 Sep 18.

Complex phosphatase regulation of Ca2+-activated Cl- currents in pulmonary arterial smooth muscle cells

Affiliations

Complex phosphatase regulation of Ca2+-activated Cl- currents in pulmonary arterial smooth muscle cells

Ramon Ayon et al. J Biol Chem. .

Abstract

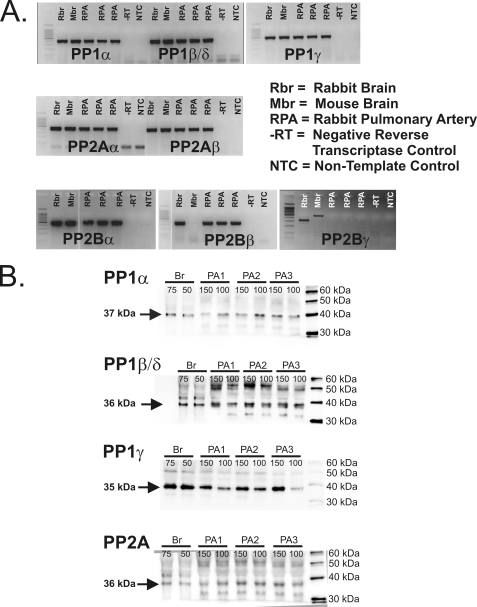
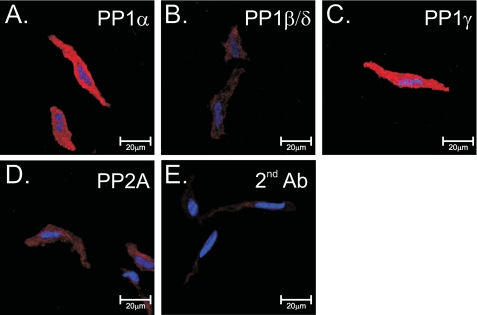
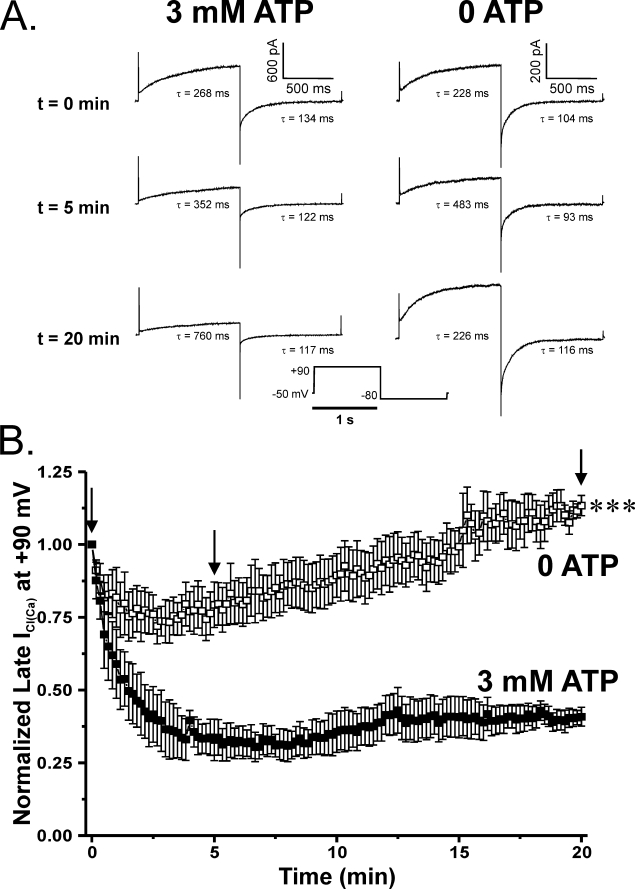
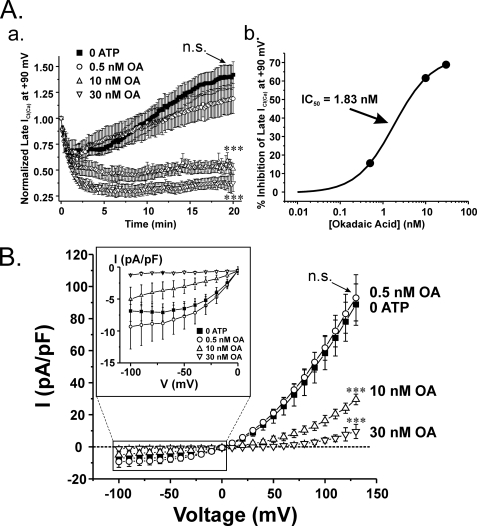
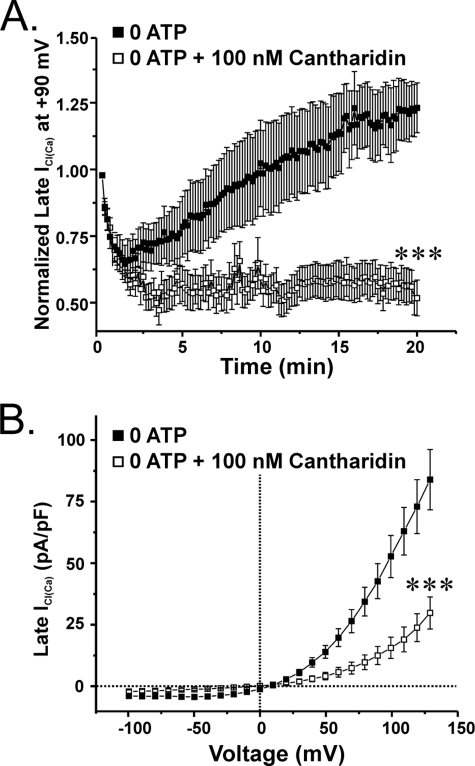
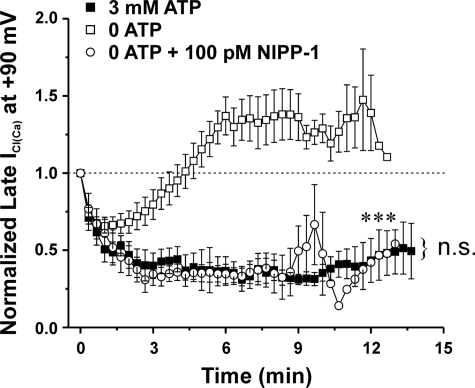
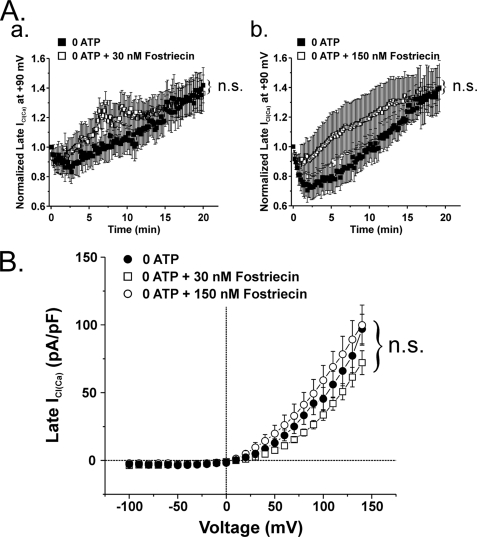
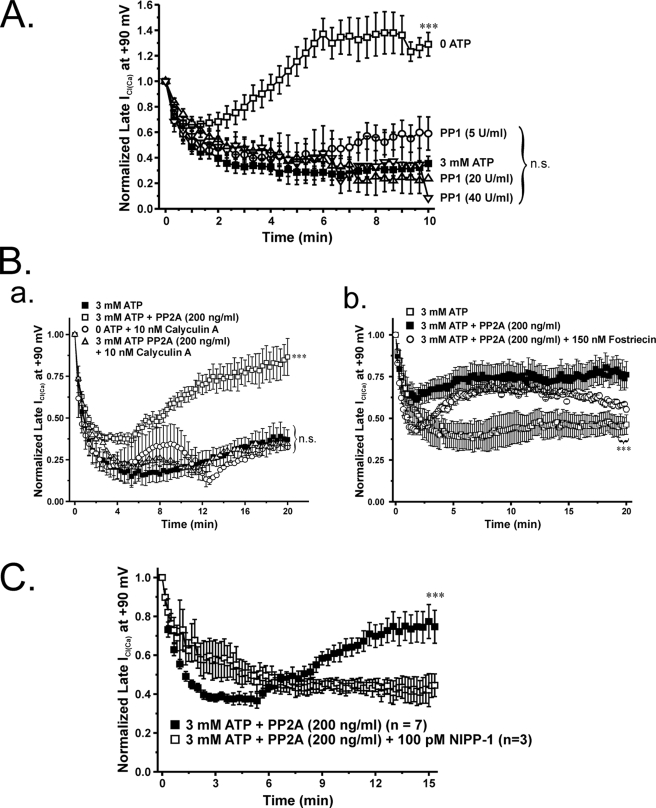
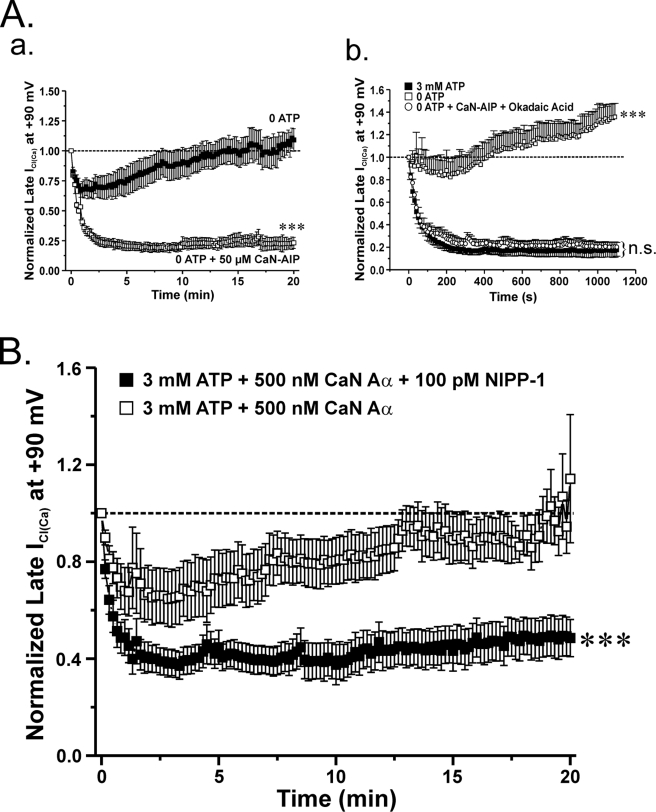
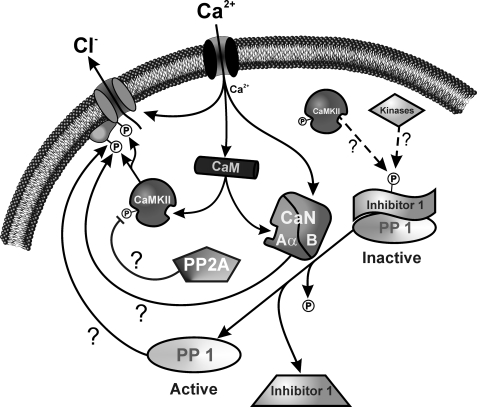
The present study was undertaken to determine whether the two ubiquitously expressed Ca(2+)-independent phosphatases PP1 and PP2A regulate Ca(2+)-activated Cl(-) currents (I(Cl(Ca))) elicited by 500 nM [Ca(2+)](i) in rabbit pulmonary artery (PA) myocytes dialyzed with or without 3 mM ATP. Reverse transcription-PCR experiments revealed the expression of PP1alpha, PP1beta/delta, PP1gamma, PP2Aalpha, PP2Abeta, PP2Balpha (calcineurin (CaN) Aalpha), and PP2Bbeta (CaN Abeta) but not PP2Bgamma (CaN Agamma) in rabbit PA. Western blot and immunofluorescence experiments confirmed the presence of all three PP1 isoforms and PP2A. Intracellular dialysis with a peptide inhibitor of calcineurin (CaN-AIP); the non-selective PP1/PP2A inhibitors okadaic acid (0.5, 10, or 30 nM), calyculin A (10 nM), or cantharidin (100 nM); and the selective PP1 inhibitor NIPP-1 (100 pM) potently antagonized the recovery of I(Cl(Ca)) in cells dialyzed with no ATP, whereas the PP2A-selective antagonist fostriecin (30 or 150 nM) was ineffective. The combined application of okadaic acid (10 nM) and CaN-autoinhibitory peptide (50 microM) did not potentiate the response of I(Cl(Ca)) in 0 ATP produced by maximally inhibiting CaN or PP1/PP2A alone. Consistent with the non-additive effects of either classes of phosphatases, the PP1 inhibitor NIPP-1 (100 pM) antagonized the recovery of I(Cl(Ca)) induced by exogenous CaN Aalpha (0.5 microM). These results demonstrate that I(Cl(Ca)) in PA myocytes is regulated by CaN and PP1 and/or PP2A. Our data also suggest the existence of a functional link between these two classes of phosphatases.


Figures

FIGURE 1.
FIGURE 1.
Detection of multiple isoforms for PP1, PP2A, and PP2B in the rabbit pulmonary artery. A, reverse transcription-PCR revealed significant expression in the rabbit pulmonary artery for PP1α, PP1β/δ, PP1γ, PP2Aα, PP2Aβ, PP2Bα, and PP2Bβ but not PP2Bγ. B, Western blot analysis performed on tissue homogenates from rabbit pulmonary artery. Homogenates from rabbit brain served as a positive control. These data revealed the presence of PP1α, PP1β/δ, PP1γ, and PP2A (isoform-specific antibodies were not available for PP2A). The number above each lane represents the amount of protein loaded in μg.
FIGURE 2.
FIGURE 2.
Immunodetection of protein phosphatases in rabbit pulmonary artery smooth muscle cells. Shown is immunolabeling of isolated cells for PP1α (A), PP1β/δ (B), PP1γ (C), and PP2A (D), all detected using a biotinylated anti-goat antibody (red) with streptavidin. E, cells labeled with secondary antibody only. For all images, nuclei were stained with bisbenzamide (blue). Image series were taken in the z-dimension at 0.5-μm intervals, and a full cross-section of the cell was selected for display purposes.
FIGURE 3.
FIGURE 3.
Effects of altering ATP levels and the state of global phosphorylation on Ca2+-activated Cl currents elicited by 500 nm Ca2+. A, representative current traces evoked with a 500 nm Ca2+ pipette solution containing either no ATP or supplemented with 3 mm ATP. Under conditions supporting global phosphorylation, both the time-dependent outward current at +90 mV and the inward tail current at −80 mV were substantially attenuated over the course of 20 min. However, PA myocytes dialyzed in the absence of exogenous ATP showed enhanced ICl(Ca), following a transient decline in amplitude, which continued to grow beyond the initial current over the course of the 20-min protocol. Time constants (τ) of activation and deactivation are shown for each representative trace and are displayed for both sets of experiments at t = 0, 5, and 20 min. B, plot showing the mean time course of changes of normalized late current at +90 mV (1-s steps at 10-s intervals). Currents were normalized against the initial current recorded immediately following membrane rupture (t = 0) and plotted as a function of time. Cells dialyzed with 3 mm ATP (filled squares; n = 4) displayed ICl(Ca) that declined to ∼40% of the initial level after 20 min. ICl(Ca) recorded from cells dialyzed with a solution lacking ATP (empty squares; n = 7) ran down to about 75% of its initial amplitude. Recovery of ICl(Ca) in these cells could be seen as early as 3 min to equal initial amplitude after 15 min and finally exceed it by ∼10% after 20 min. ***, significantly different from 3 mm ATP with p < 0.001.
FIGURE 4.
FIGURE 4.
Dose-dependent inhibition of ICl(Ca) recovery by the non-selective PP1 and PP2A inhibitor okadaic acid. A (a), mean time course of changes of normalized ICl(Ca) for control cells dialyzed with no ATP (closed squares; n = 13) and cells dialyzed with 0 ATP and 0.5 nm (open circles; n = 5), 10 nm (open triangle; n = 5) or 30 nm (open inverted triangle; n = 5) OA. 0.5 nm OA produced no significant effect on ICl(Ca) rundown and delayed recovery (p > 0.05). Cells dialyzed with 10 or 30 nm OA produced a strong inhibitory effect on ClCa channel current recovery, which closely resembles data obtained from cells treated with either CaN inhibitors (Fig. 4) or 3 mm ATP (Fig. 3). One-way ANOVA test at the end of 20 min revealed that the population means were significantly different with p < 0.001 (***). Bonferroni post hoc tests showed significant differences between 10 and 30 nm and control (no OA; p < 0.05), whereas 0.5 nm OA was not significantly different from control (p > 0.05). A (b), dose-dependent curve derived from the data shown in A (a) after 20 min of cell dialysis with OA. Mean data for the last five traces of normalized late current from our 20-min protocol were used to determine the percentage inhibition using the equation, ((COA)/C) × 100, where C represents control condition, and OA indicates myocytes treated with 0.5, 10, or 30 nm OA. Percentage inhibition of late ICl(Ca) was plotted as a function of OA concentration on a log scale and fitted to a logistic function by nonlinear least-squares fitting provided by Origin version 7.5 to determine the IC50. As shown, the calculated IC50 was 1.83 nm. B, current-voltage relationships of ICl(Ca) expressed as current density (pA/picofarads) obtained in the absence or presence of okadaic acid. Higher concentrations of OA (10 and 30 nm) dose-dependently inhibited outwardly rectifying ICl(Ca), whereas 0.5 nm OA failed to alter ICl(Ca) magnitude. As for the time courses shown in A (a), a one-way ANOVA test at +130 mV revealed that the population means were significantly different with p < 0.001 (***). Bonferroni post hoc tests showed significant differences between 10 and 30 nm and control (no OA; p < 0.05), whereas 0.5 nm OA was not significantly different from control (p > 0.05). Inset, magnified view of the I-V relationships at negative test potentials. n.s., not significant (both panels).
FIGURE 5.
FIGURE 5.
The PP1/PP2A inhibitor cantharidin inhibits the delayed recovery of ICl(Ca) in pulmonary arterial myocytes dialyzed with no ATP. A, graph showing the impact of the internal application of 100 nm cantharidin, a compound displaying higher selectivity for inhibiting PP2A over PP1, on the mean time course of normalized late ICl(Ca) at +90 mV (1-s steps at 10-s intervals) in cells lacking a supply of exogenous ATP. Cantharidin (empty squares; n = 12) enhanced the initial rundown of ICl(Ca) and prevented the delayed recovery seen under control conditions (filled squares; n = 9). ***, significantly different from control (no cantharidin) with p < 0.001. B, graph showing the mean current-voltage relationships obtained in the presence (empty squares; n = 12) or absence (filled squares; n = 9) of 100 nm cantharidin. The inhibitor successfully blocked the outwardly rectifying current by ∼58 and 64% at +20 and +130 mV, respectively. At +130 mV, the population means are significantly different with p < 0.001 (***). Both control- and cantharidin-treated cells reversed near ECl.
FIGURE 6.
FIGURE 6.
The highly specific endogenous PP1 inhibitor NIPP-1 obliterates the recovery of ICl(Ca) in the absence of internal ATP. A graph illustrates the mean time course of changes of normalized late ICl(Ca) recorded at +90 mV (1-s steps at 20-s intervals) in cells dialyzed with 3 mm ATP (filled squares; n = 4) or in the absence of ATP with (empty circles; n = 5) or without 100 pm NIPP-1 (empty squares; n = 9), as indicated. NIPP-1 enhanced ICl(Ca) rundown and abolished its delayed recovery seen in the absence of ATP (***, p < 0.001 relative to 0 ATP and no blockers). The extent of inhibition of ICl(Ca) by NIPP-1 was similar to the level of rundown induced by 3 mm ATP. n.s., not significant.
FIGURE 7.
FIGURE 7.
The highly selective inhibitor of PP2A fostriecin has no effect on ICl(Ca) recorded in the absence of internal ATP. A (a), plot showing the time course of changes of mean normalized late ICl(Ca) recorded at +90 mV (1-s steps at 10-s intervals) in cells dialyzed with no ATP, in the presence (empty squares; n = 10) or absence (filled squares; n = 7) of 30 nm fostriecin, a concentration ∼10-fold higher than the IC50 for PP2A (3.2 nm). At this concentration, the compound failed to alter ICl(Ca) amplitude at +90 mV during the initial rundown and late recovery over the course of 20 min. A (b), similar graph to that shown in A (a) except that for these experiments, fostriecin concentration was raised to 150 nm (47-fold higher than the IC50 for PP2A). Data obtained with (empty squares) or without (filled squares) fostriecin were obtained from 7 and 10 cells, respectively. Similar to the results illustrated previously, this concentration of fostriecin was unsuccessful in attenuating the recovery of late ICl(Ca). B, current-voltage relationships for late ICl(Ca) in cells dialyzed with 0 ATP, in the absence (filled squares; n = 3) or presence of 30 (empty squares; n = 3) or 150 nm (empty circles; n = 2) fostriecin. All I-V values were obtained immediately following the conclusion of the 20-min test protocol. Consistent with the data presented in A, this graph illustrates the lack of effect of fostriecin on ICl(Ca) at voltages ranging from −100 to +130 mV. n.s., not significant (all panels).
FIGURE 8.
FIGURE 8.
Effects of internal application of a constitutively active form of PP1 or PP2A on phosphorylation-induced rundown of ICl(Ca). To further elucidate the role of Ca2+-independent phosphatases, we investigated the effects of supplying constitutively an active form of PP1 or PP2A intracellularly. In these experiments, the pipette solution contained 3 mm ATP to support phosphorylation. A, graph showing the mean time course of changes of normalized late ICl(Ca) recorded at +90 mV (1-s steps applied at 20-s intervals) in the presence of ATP only (filled squares; n = 10) or with 3 mm ATP and one of three PP1 concentrations ranging from 5 to 40 units/ml, as indicated (n = 7–8 per group of cells). All three PP1 concentrations failed to significantly influence the time course of ICl(Ca) rundown induced by 3 mm ATP. A one-way ANOVA test revealed that the population means were significantly different with p < 0.001 (***). Bonferroni post hoc tests showed significant differences between all conditions, including drugs and 3 mm ATP, and 0 ATP (p < 0.05); no significant differences were noted between ATP alone and ATP plus any of the three PP1 concentrations tested (p > 0.05). B (a) graph similar to that displayed in A showing the effect of intracellular application of PP2A (200 ng/ml; empty squares; n = 5) on the mean time course of normalized late ICl(Ca) recorded at +90 mV (1-s steps applied at 20-s intervals). PP2A successfully reserved the rundown of ICl(Ca) induced by 3 mm ATP (filled squares; n = 4). The cells concurrently treated with PP2A and calyculin A (10 nm), a potent inhibitor of PP1/PP2A, reversed the recovery of late ICl(Ca) seen with PP2A alone (empty circles; n = 5). A one-way ANOVA test revealed that the population means were significantly different with p < 0.001 (***). Bonferroni post hoc tests showed significant differences between PP2A and 3 mm ATP and all other groups; all other comparisons were not significant (p > 0.05). Similar to OA, cantharidin, and NIPP-1, intracellular application of calyculin A alone suppressed the recovery of ICl(Ca) in cells dialyzed with no ATP (empty triangles; n = 2). n.s., not significant (both panels). B (b), graph displaying the mean time course of normalized late ICl(Ca) at +90 mV in the presence of ATP only (open squares; n = 4) or accompanied with either PP2A (200 ng/ml; filled squares; n = 8) or PP2A and fostriecin (150 nm; open circles; n = 2). A one-way ANOVA test revealed that the population means were significantly different with p < 0.001 (***). Bonferroni post hoc tests showed significant differences between 3 mm ATP, PP2A, and PP2A plus fostriecin. C, graph illustrating the mean time course of normalized late ICl(Ca) at +90 mV in the presence of either 3 mm ATP and PP2A (200 ng/ml) (filled squares) or 3 mm ATP, PP2A, and 100 pm NIPP-1 (empty squares). Unpaired student t test exhibited statistical significant differences with p < 0.001 (***) between cells dialyzed with 3 mm ATP + PP2A and those cells presented with 3 mm ATP + PP2A + NIPP-1.
FIGURE 9.
FIGURE 9.
A functional link between calcineurin and PP1 appears to exist when it comes to the regulation of ICl(Ca) in rabbit pulmonary artery smooth muscle cells. A (a), mean time course of changes of normalized ICl(Ca) amplitude in the presence (open squares; n = 4) or absence (closed squares; n = 5) of 50 μm calcineurin autoinhibitory peptide (CaN-AIP). Exposure to 50 μm CaN-AIP suppressed the recovery of ICl(Ca). ClCa currents were reduced by ∼80% after 20 min when compared with control conditions. ***, significantly different from control (no CaN-AIP) with p < 0.001. A (b), graph showing the mean time course of changes of normalized ICl(Ca) at +90 mV (1-s steps at 10-s intervals) in cells dialyzed with 3 mm ATP (filled squares; n = 5) or no ATP, with (empty circles; n = 4) or without (empty squares; n = 5) 10 nm OA (PP1/PP2A inhibitor) and 50 μm CaN-AIP (CaN inhibitor). A one-way ANOVA test at the end of 20 min revealed that the population means were significantly different with p < 0.001 (***). n.s., not significant. B, to determine whether a functional link exists between CaN and PP1, our group examined the effects of the constitutively active calcineurin isoform CaN Aα in the presence of the PP1-specific inhibitor NIPP-1 under conditions that support phosphorylation. As indicated by the graph, which represents normalized late ICl(Ca) at +90 mV plotted as a function of time, 500 nm CaN Aα fully reverses the phosphorylation-mediated rundown of ICl(Ca) (open squares; n = 7). On the contrary, the effect of CaN Aα on ICl(Ca) recovery was significantly attenuated with the addition of 100 pm NIPP-1 to the pipette solution (closed squares; n = 10). The degree of rundown produced by 100 pm NIPP-1 was similar to that seen with 3 mm ATP. ***, significantly different from 3 mm ATP + 500 nm CaN Aα with p < 0.001.
FIGURE 10.
FIGURE 10.
Proposed schematic representation of ClCa channel regulation by CaMKII and Ca2+-dependent and -independent phosphatases in pulmonary arterial smooth muscle cells. As intracellular Ca2+ levels rise in pulmonary artery smooth muscle cells, ClCa channels are directly activated by Ca2+ and modulated by phosphorylation involving CaMKII and CaN Aα via Ca2+ binding to Ca2+-calmodulin and calcineurin B (CaN B). In the presence of ATP, CaMKII phosphorylation is favored over the effects produced by phosphatases. In the absence of ATP, this balance is shifted toward phosphatases, yielding up-regulation of ICl(Ca) following a transient state of phosphorylation due to consumption of the endogenous substrate. Under these conditions, dephosphorylation of I-1 by CaN Aα would relieve its inhibitory effect on PP1, which would then dephosphorylate the pore-forming or accessory subunit.

References

    1. Chipperfield A. R., Harper A. A. (2000) Prog. Biophys. Mol. Biol. 74, 175–221 - PubMed
    1. Large W. A., Wang Q. (1996) Am. J. Physiol. 271, C435–C454 - PubMed
    1. Leblanc N., Ledoux J., Saleh S., Sanguinetti A., Angermann J., O'Driscoll K., Britton F., Perrino B. A., Greenwood I. A. (2005) Can J. Physiol. Pharmacol. 83, 541–556 - PubMed
    1. Greenwood I. A., Ledoux J., Leblanc N. (2001) J. Physiol. 534, 395–408 - PMC - PubMed
    1. Wang Y. X., Kotlikoff M. I. (1997) Proc. Natl. Acad. Sci. U.S.A. 94, 14918–14923 - PMC - PubMed

Publication types

MeSH terms

LinkOut - more resources