. 2009 Dec;19(12):2288-99.
doi: 10.1101/gr.094060.109. Epub 2009 Sep 18.

Predictable dynamic program of timing of DNA replication in human cells

Affiliations

Predictable dynamic program of timing of DNA replication in human cells

Romain Desprat et al. Genome Res. 2009 Dec.

Abstract

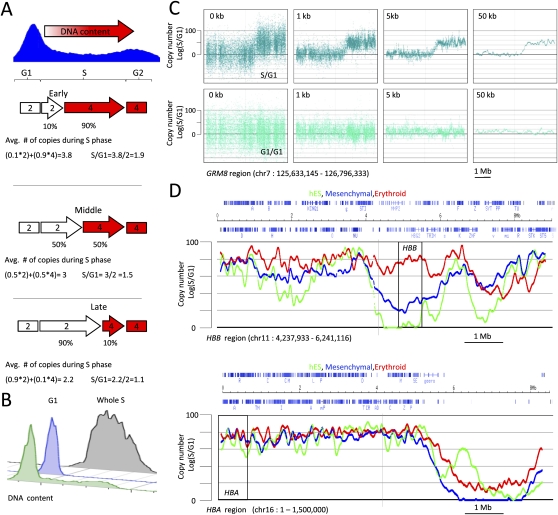
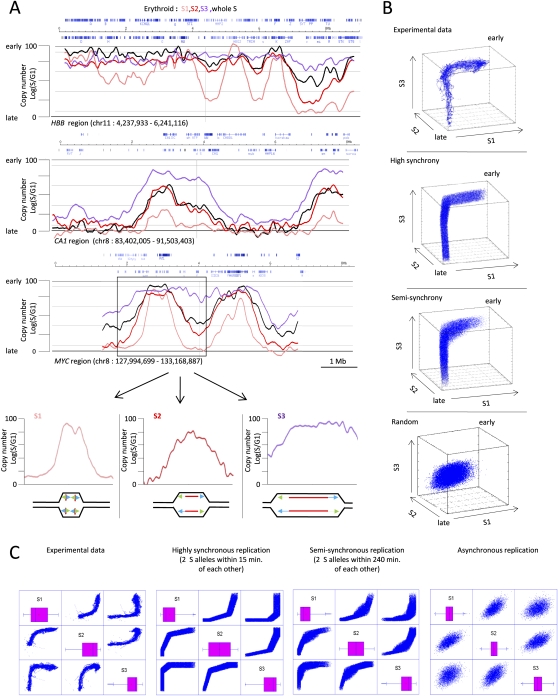
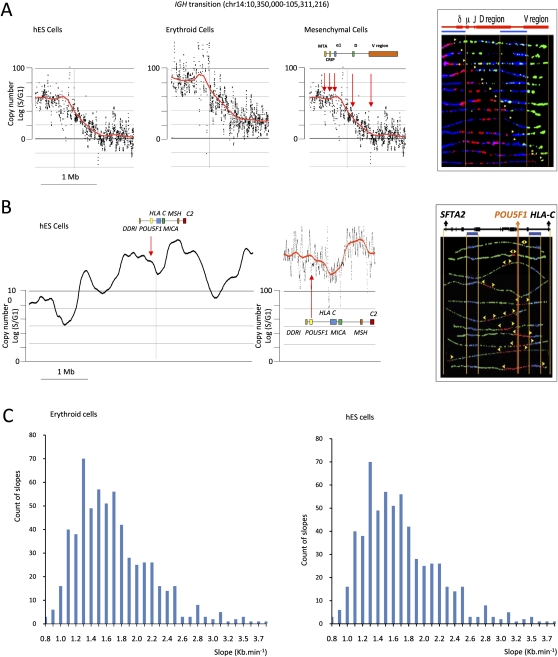
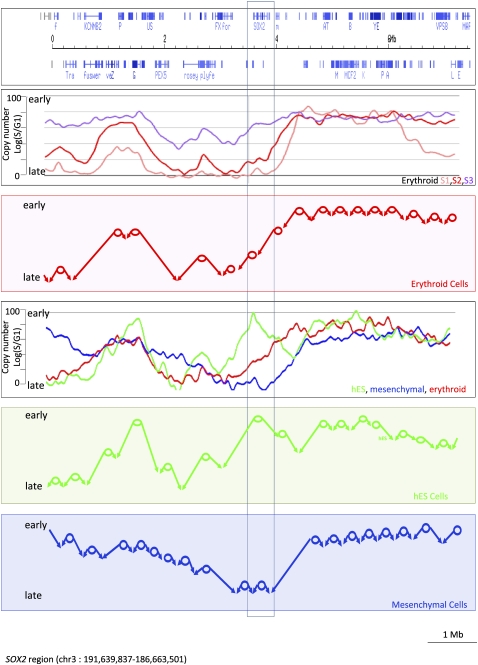
The organization of mammalian DNA replication is poorly understood. We have produced high-resolution dynamic maps of the timing of replication in human erythroid, mesenchymal, and embryonic stem (ES) cells using TimEX, a method that relies on gaussian convolution of massive, highly redundant determinations of DNA copy-number variations during S phase to produce replication timing profiles. We first obtained timing maps of 3% of the genome using high-density oligonucleotide tiling arrays and then extended the TimEX method genome-wide using massively parallel sequencing. We show that in untransformed human cells, timing of replication is highly regulated and highly synchronous, and that many genomic segments are replicated in temporal transition regions devoid of initiation, where replication forks progress unidirectionally from origins that can be hundreds of kilobases away. Absence of initiation in one transition region is shown at the molecular level by single molecule analysis of replicated DNA (SMARD). Comparison of ES and erythroid cells replication patterns revealed that these cells replicate about 20% of their genome in different quarters of S phase. Importantly, we detected a strong inverse relationship between timing of replication and distance to the closest expressed gene. This relationship can be used to predict tissue-specific timing of replication profiles from expression data and genomic annotations. We also provide evidence that early origins of replication are preferentially located near highly expressed genes, that mid-firing origins are located near moderately expressed genes, and that late-firing origins are located far from genes.


Figures

Figure 1.
Figure 1.
TimEX. (A) Principle of the technique. Copy number of DNA in sorted S-phase cells compared with sorted G1 cells can be used as a surrogate measurement for the timing of replication (see text). (B) Typical pre- and post-sort DNA content profiles of cycling basophilic erythroblasts detected by staining with propidium iodide. Green profile, pre-sort DNA content profiles; blue and gray, respectively, G1 and S post-sort profiles. (C) Scatterplots illustrating smoothing by Gaussian convolution. Top and bottom panels are, respectively, scatterplots of S/G1 and control G1/G1 ratios for the 8-mb GRM8 region on chr 7 (see Supplemental Table S1). (X-axis) Genomic position; (y-axis) normalized S/G1 or G1/G1 ratio. The left panels illustrate the results without any smoothing; the three panels on the right show the same data smoothed by Gaussian convolution of sigma equal to 1, 5, or 50 kb. As expected, the G1/G1 ratio is flat, while the S/G1 ratio varies. High S/G1 ratios indicate regions that replicate early in S phase, low S/G1 ratios regions that replicate late in S phase. (D) Comparison of the timing of replication in hESCs and in mesenchymal and erythroid cells derived from hESCs. The scatterplots are as above. The red, green, and blue curves, respectively, represent the TimEX profiles of the three cell types. A total of 8-Mb regions containing the beta hemoglobin (HBB) and the alpha hemoglobin (HBA) are shown. All of the other regions present in the arrays are shown in Supplemental Figure S2. The profiles in the three cell types are different, but the overall shape of the curves and the slopes of the transition regions are similar, suggesting that the underlying molecular mechanisms are the same. Differences between cell types are particularly evident in gene-poor regions.
Figure 2.
Figure 2.
TimEX-seq. (A) Comparison of TimEX results obtained using tiling arrays or massively parallel sequencing (basophilic erythroblasts). The S/G1 ratio of the frequency of uniquely matched reads in 5-kb windows was calculated and smoothed as in Figure 1. (X-axis) Genomic distances; (y-axis) S/G1 ratio for sequencing, and log2 (S/G1) for tiling arrays. Sequencing and tiling arrays produce very similar profiles. (B) Coefficient of correlation between tiling array and sequencing results. (C) Comparison of TimEX results obtained using tiling arrays or massively parallel sequencing (hESC). (D, top) Examples of chromosome-wide TimEX-seq profiles obtained based on 10.5 million (basophilic erythroblasts) and 13 million reads (hESC). A sigma of 100 kb was used for the Gaussian convolution. (Bottom) Differential timing curve for hESC and erythroid cells obtained by subtracting the hESC profile from the erythroid profile.
Figure 3.
Figure 3.
S-phase subfractionation experiments. (A) Scatterplots illustrating TimEX profiles for three genomic regions 5–8 Mb in size. The black curve represents the results for the entire sorted S phase; the pink, red, and purple curves the profiles for the early, middle, and late fractions, respectively. As expected, the profile of the whole S fraction resembles the average of the three fractions. The timing of replication varies over large domains. Analysis of these curves suggests that replication is highly regulated. (Bottom) Our molecular interpretation of one of the two major peaks observed in the myc region. Blue and green arrows represent progressing forks of replication; (red lines) newly replicated DNA. (B, top) Three-dimensional scatterplots illustrating the experimental S/G1 ratio of the early, middle, and late (S1/S2/S3) fractions plotted for all 10-kb genomic windows represented in the array. The three panels below illustrate the S1/S2/S3 scatterplots obtained from simulations in which the replication is assumed to be perfectly synchronous, semisynchronous, or asynchronous (see text, movies M1–M4, and Supplemental Fig. S9 for more plots and the algorithms used for the simulations). The experimental data are most similar to the synchronous replication model, suggesting that the order in which DNA is replicated during S phase is highly regulated. (C) Two-dimensional projections of the three-dimensional plots of B.
Figure 4.
Figure 4.
SMARD analysis. (A) The IGH@ region. (Three left panels) Scatterplots of the results of TimEX analysis in the IGH locus in basophilic erythroblasts, mesenchymal cells, and undifferentiated hESC. The black dots represent the S/G1 ratio using Gaussian convolution windows of 5 kb. The red curve shows the same data smoothed using windows of 200 kb. (Right panel) The SMARD analysis in human mesenchymal cells for a 161-kb PmeI segment of the IGH@ locus that is within the predicted transition region. All of the molecules are stained red at the left end (3′) and green at the right end (5′), indicating that in these mesenchymal stem cells a single replication fork proceeds from 3′ to 5′ (from early to late in S) continuously through the PmeI fragment analyzed at the IGH locus. A genomic map is included above the segment. The blue bars indicate the positions of the two blue biotinylated probes used to identify the segment by FISH (see Supplemental Fig. S8). The vertical orange lines delineate the location of the gene on the segment. The other vertical orange lines indicate the boundaries of the FISH probes. The yellow arrowheads indicate the direction in which the replication fork moves. These results validate the TimEX analysis and demonstrate a long transition region in the human IGH@ locus similar to the one previously reported in the mouse Igh region. (B) The POU5F1 region. (Two left panels) Scatterplots of the results of TimEX analysis in the POU5F1 region in hES cells. The panel to the left represents 6 Mb, the middle panel, 400 kb. Smoothing is as above. This TimEX profile suggests that this region is rich in origins, since replication seems to occur within the first hour of S over a 1-Mb segment. The panel to the right illustrates a SMARD analysis of a 350-kb segment containing the POU5F1 gene. A map of the 350-kb POU5F1 segment is shown above the image. As expected, (yellow) forks going in both directions can be detected in many molecules, suggesting that the region is indeed rich in origins. (C) Histograms illustrating the slope of the transition regions larger than 250 kb calculated genome-wide for hESC and erythroid cells. The method to calculate the slope is described in the Methods section.
Figure 5.
Figure 5.
Timing of DNA replication and gene transcription. (A) Scatterplot illustrating the relationship between gene transcription and timing of replication in basophilic erythroblasts and in hESC cells. (X-axis) Mean mRNA expression (determined using Affymetrix U133plus arrays) grouped into 10 bins of equal number of probesets and of increasing expression signals. (Y-axis) Average TimEX values (and standard errors) for all 5-kb genomic windows containing an Affymetrix U133plus probeset are plotted. On average, expressed genes are replicating earlier than unexpressed genes. (B) Histograms illustrating that differentially expressed genes are preferentially located in regions where timing differs between hESC and erythroid cells. (X-axis) Fold differential expression; (y-axis) percent differentially expressed genes. (C) Scatterplots illustrating relationship between timing and distance to expressed genes: Distances of all 5-kb genomic windows to the closest 5-kb window containing either a highly expressed Affymetrix Probeset (top 0–25 quartile), a moderately expressed (25–50 quartile), a poorly expressed (50–75 quartile), or a silent (75–100 quartile) probeset were calculated (see text). The average TimEX value for all windows at the same distance to a probeset was then plotted against their distances to the closest probeset for each of the four quartiles. This plot reveals that the timing of replication is highly dependent on distance to highly expressed probesets since (in the case of erythroid cells) the averaged TimEX value was about 76 for windows containing an actively expressed probeset (distance = 0), and decreased to <30 for windows more than 2-Mb away from a highly expressed probeset. Analysis of the other quartiles shows that the relationship between timing and distance to probeset decreases for less expressed genes, and almost completely disappears for silent genes, suggesting that gen-expression levels directly correlate with timing of origin firing. (D) TimEX values (not averaged) for 5-kb windows covering chromosome 14 (blue line) are plotted against the distance of each window to the closest highly expressed gene (top 0–10 percentile) to illustrate the variability of the TimEX values (which cannot be appreciated in C because of averaging). The red line illustrated the best fitting reciprocal equation (r = 0.81). Supplemental Figure S12 shows similar analysis for all chromosomes. (D) Profiles of predicted timing of replication obtained by calculating the inverse of the distance of each genomic window to the closest Affymetrix Probeset and multiplying it by a coefficient equal to the normalized expression signals of the same probeset (see Methods). The red boxes highlight a peak that is present in hESC but not in erythroid cells, both in the experimental and in the predicted values. (E) Scatterplot illustrating correlation between experimental and predicted timing profiles for chromosome 14.
Figure 6.
Figure 6.
Model of DNA replication in mammalian cells. (Top panel) An 8-Mb region centered on the SOX2 gene region; the second panel is the result of a TimEX analysis of sorted early, middle, and late S fractions from basophilic erythroblasts. The red circles in the third panel represent the major zones containing origins of replication that can be deduced from an analysis of the second panel; the arrows show the predicted fork direction in erythroid cells starting from these origins. The main features of the model are that (1) active origins of replication are unevenly distributed in the genome and relatively rare in parts of the genome, creating large initiation free regions, (2) origins are programmed to fire within narrow time windows during S phase, (3) lack of pause sites creates long transition regions in which the forks progress unidirectionally. The fourth panel represents the TimEX profiles of whole S fractions from basophilic erythroblasts (red), mesenchymal cells (blue), and hESC (green) in the same region. The two bottom panels illustrate the predicted organization of the replication of this genomic segment in hESC and mesenchymal cells. One segment with major differences in timing between the three cell lines is boxed in the immediate neighborhood of the SOX2 gene, which is expressed at a high level in hESC and silent in erythroid and mesenchymal cells (data not shown). Because of the paucity of active origins in the region, the tissue-specific activation in hESC of an early origin or zone of initiation, which appears to coincide with the SOX2 gene, has dramatic repercussions in both the timing of replication and the fork directions in a megabase-wide region.

References

    1. Aladjem MI. Replication in context: Dynamic regulation of DNA replication patterns in metazoans. Nat Rev Genet. 2007;8:588–600. - PubMed
    1. Dalgaard JZ, Klar AJ. Orientation of DNA replication establishes mating-type switching pattern in S. pombe. Nature. 1999;400:181–184. - PubMed
    1. Delgado S, Gomez M, Bird A, Antequera F. Initiation of DNA replication at CpG islands in mammalian chromosomes. EMBO J. 1998;17:2426–2435. - PMC - PubMed
    1. DePamphilis ML. The search for origins of DNA replication. Methods. 1997;13:211–219. - PubMed
    1. Dutta D, Ensminger AW, Zucker JP, Chess A. Asynchronous replication and autosome-pair non-equivalence in human embryonic stem cells. PLoS One. 2009;4:e4970. doi: 10.1371/journal.pone.0004970. - DOI - PMC - PubMed

Publication types

Associated data