. 2009 Nov;297(5):H1594-605.
doi: 10.1152/ajpheart.00579.2009. Epub 2009 Sep 18.

Increased susceptibility of aged hearts to ventricular fibrillation during oxidative stress

Affiliations

Increased susceptibility of aged hearts to ventricular fibrillation during oxidative stress

Norishige Morita et al. Am J Physiol Heart Circ Physiol. 2009 Nov.

Abstract

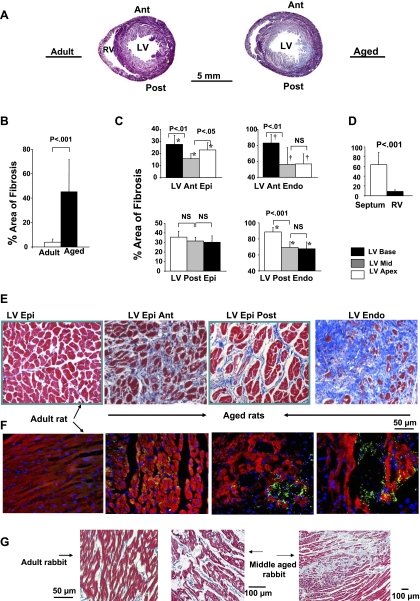
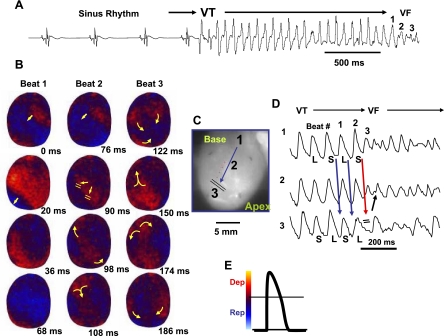
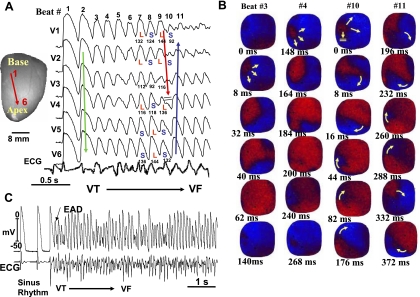
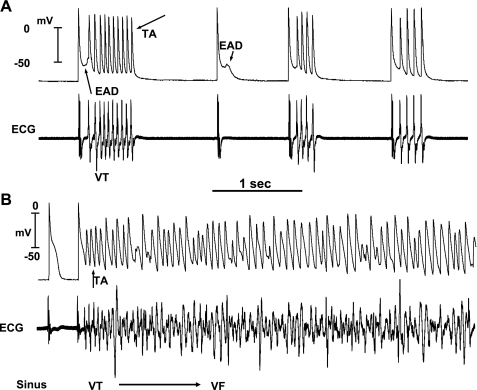
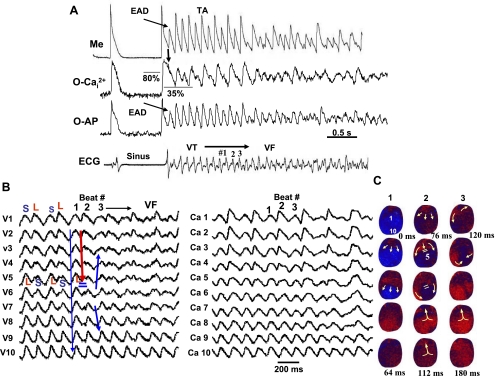
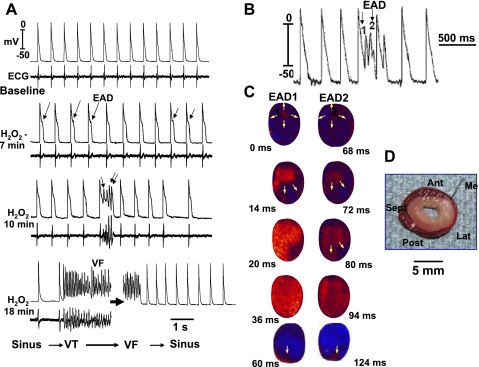
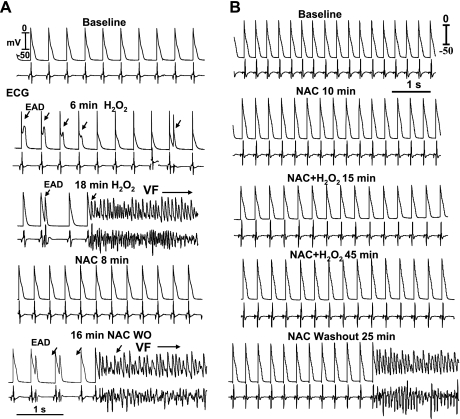
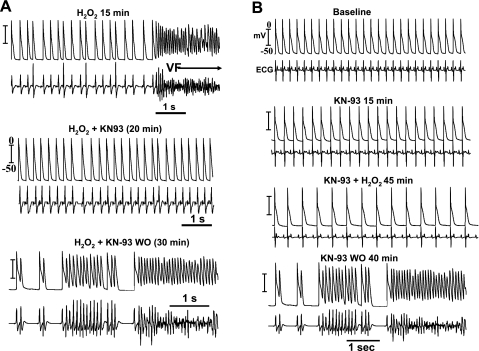
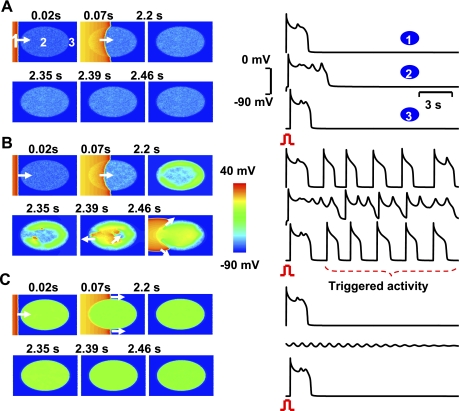
Oxidative stress with hydrogen peroxide (H(2)O(2)) readily promotes early afterdepolarizations (EADs) and triggered activity (TA) in isolated rat and rabbit ventricular myocytes. Here we examined the effects of H(2)O(2) on arrhythmias in intact Langendorff rat and rabbit hearts using dual-membrane voltage and intracellular calcium optical mapping and glass microelectrode recordings. Young adult rat (3-5 mo, N = 25) and rabbit (3-5 mo, N = 6) hearts exhibited no arrhythmias when perfused with H(2)O(2) (0.1-2 mM) for up to 3 h. However, in 33 out of 35 (94%) aged (24-26 mo) rat hearts, 0.1 mM H(2)O(2) caused EAD-mediated TA, leading to ventricular tachycardia (VT) and fibrillation (VF). Aged rabbits (life span, 8-12 yr) were not available, but 4 of 10 middle-aged rabbits (3-5 yr) developed EADs, TA, VT, and VF. These arrhythmias were suppressed by the reducing agent N-acetylcysteine (2 mM) and CaMKII inhibitor KN-93 (1 microM) but not by its inactive form (KN-92, 1 microM). There were no significant differences between action potential duration (APD) or APD restitution slope before or after H(2)O(2) in aged or young adult rat hearts. In histological sections, however, trichrome staining revealed that aged rat hearts exhibited extensive fibrosis, ranging from 10-90%; middle-aged rabbit hearts had less fibrosis (5-35%), whereas young adult rat and rabbit hearts had <4% fibrosis. In aged rat hearts, EADs and TA arose most frequently (70%) from the left ventricular base where fibrosis was intermediate ( approximately 30%). Computer simulations in two-dimensional tissue incorporating variable degrees of fibrosis showed that intermediate (but not mild or severe) fibrosis promoted EADs and TA. We conclude that in aged ventricles exposed to oxidative stress, fibrosis facilitates the ability of cellular EADs to emerge and generate TA, VT, and VF at the tissue level.


Figures

Fig. 1.
Fig. 1.
Masson trichrome and discoidin domain receptor-2 staining in adult and aged ventricles. A: low-power magnification of the entire cross-sectional view of an adult and aged rat hearts. Notice the increased fibrosis in the aged (blue stain) with almost complete fibrosis at the endocardium (Endo) and diffuse fibrosis of the posterior left ventricle (LV) and the septum. B: overall percent area of fibrosis in adult and aged ventricles. C and D: regional variations of percent fibrosis at 14 different ventricular sites. E: trichrome stain that stains collagen blue. F: discoidin domain receptor 2 that stains the fibroblast in green. G: trichrome stain in adult (left) and middle-aged rabbits (middle and right) in which H2O2 induced spontaneous ventricular fibrillation (VF). Ant, anterior; RV, right ventricle; Post, posterior; Epi, epicardium; NS, not significant.
Fig. 2.
Fig. 2.
Spontaneous initiation of ventricular tachycardia (VT)/VF in an aged rat heart exposed to 0.1 mM H2O2. A: ECG showing the last 5 sinus beats before the sudden onset of VT leading to VF. B: voltage snapshots of the last beat of the VT (beat 1) and of the first 2 beats of the VF (beats 2 and 3). In each snapshot, activation time (in ms) is shown at the bottom right with time 0 (arbitrary) coinciding with the onset of beat 1. The red color in the snapshots represents depolarization (Dep) and the blue repolarization (Rep) as shown in E. The yellow arrows in the snapshots represent the direction of the wavefront propagation with double horizontal lines denoting the site of conduction block. The VT originates from a focal site at the LV base and propagates as single wavefront toward the apex and undergoes functional conduction block at site 3. The two lateral edges of the front, however, continue to propagate laterally (snapshot, 98 ms) forming figure-eight reentry (snapshot, 108 ms). During the second reentrant wavefront, another wavefront emerges from the apical site of the LV (snapshot, 122 ms), disrupting the activation pattern and signaling the onset of VF. D: 3 optical action potentials (APs; labeled 1, 2, and 3) recorded from sites identified on the heart silhouette (C). The 2 downward-pointing blue arrows indicate the direction of propagation from site 1 to site 3 with the red downward-pointing arrow showing block at site 3, followed by retrograde activation (upward-pointing arrow). Notice the emergence of spatially discordant AP duration (APD) alternans preceding conduction block at site 3 when the front with short APD (S) at site 1 encroaches a site (site 3) with long APD (L).
Fig. 3.
Fig. 3.
Spontaneous initiation of VF in a middle-aged rabbit exposed to 0.1 mM H2O2. A: 6 epicardial optical APs (V1 to V6) recorded from sites shown on the left silhouette of the heart. After 9 focal activations arising from the base of the heart (B), the wavefront undergoes block at mid-LV anterior wall after spatially discordant APD alternans emerges (A). The wavefront, however, continues to propagate lateral to the site of block in a clockwise direction causing a reentrant excitation as shown in the snapshots in B. The numbers under each snapshot is activation time starting with 0 ms (arbitrary) for beats 3 and 4 and then again for beats 10 and 11. C: microelectrode recording of another VF episode recorded in the same heart showing spontaneous initiation of VF by a mechanism compatible with early afterdepolarization (EAD)-mediated triggered activity (TA) as in aged rats shown in Figs. 4 and 5.
Fig. 4.
Fig. 4.
Simultaneous microelectrode and ECG recordings at the onset of VT/VF in an aged rat heart exposed to 0.1 mM H2O2. A: onset of EAD-mediated TA causing VT 5 min after H2O2 exposure. Note the smooth emergence of EAD (upward-pointing arrow) during the isoelectric interval on the ECG followed by a run of 10 TA (downward-pointing arrow) causing nonsustained VT on the ECG. The onset of the EAD precedes the QRS complex of the VT by 8 ms, indicating absence of electrical activity elsewhere in the heart. Two additional short runs of VT with 4 beats each are also shown that follow a single subthreshold EAD (downward small arrow) with no TA. B: degeneration of the TA to VF 15 min after H2O2 exposure.
Fig. 5.
Fig. 5.
Simultaneous microelectrode (Me) and dual optical AP (O-AP)-intracellular calcium (O-Cai2+) map at the onset of VT/VF in an aged rat heart exposed to H2O2 (0.1 mmol/l). A: single cell APs recorded with glass microelectrode along with simultaneous optical AP-Cai2+ signals recorded within 1 mm of the microelectrode. Notice that the cellular EAD arises when Cai2+ is about 80% of the peak systolic calcium transient amplitude, reflecting a slowed decline rate of Cai2+. The Cai2+ remains above the resting level (35%) during the TA, leading to VF. B: simultaneous 10 voltage and Cai2+ optical signals recorded from base to apex (shown in the snapshots in C) during the transition from VT supported by a single wavefront to wavebreak causing figure-eight reentry (C; beat 1 to beat 2) after the emergence of spatially discordant APD and Cai2+ alternans.
Fig. 6.
Fig. 6.
Cryoablation of mid- and endocardial structures in an aged rat heart and the effect of 0.1 mM H2O2. A: simultaneous microelectrode (top) and ECG (bottom) recordings in a heart subjected to cryoablation of the endo- and midmyocardial structures (whitish area in D). EADs, TA causing VF, are still present after the cryoablation procedure. C: optical snapshots of two EADs (1 and 2 in B) causing focal activation that arises from the base of the surviving thin LV epicardial rim. Snapshots in C show activation time starting with 0 ms (arbitrary) with the second EAD (EAD2) arising 68 ms after the first EAD (EAD1). Only a thin rim of epicardial tissue survives the ablation procedure as indicated by the reddish area in this triphenyltetrazolium chloride-stained cross-sectional view of the LV (D). Me, the site of microelectrode recording shown in A and B; Ant, Sep, Lat, and Post, anterior, septal, lateral, and posterior wall of the LV, respectively. Notice that the VF in this cryoablated heart terminates spontaneously within 1 min of initiation consistent with tissue mass reduction (Ref. 13).
Fig. 7.
Fig. 7.
Suppression and prevention of H2O2-induced EAD and VF in 2 aged rat hearts by N-acetylcysteine (NAC; 2 mM). A and B: simultaneous microelectrode and ECG recordings, showing NAC-induced suppression of EAD-mediated VF and its reemergence 16 min after NAC washout (WO). B: prevention of VF by NAC pretreatment and the emergence of VF 25 min after NAC WO.
Fig. 8.
Fig. 8.
Suppression and prevention of H2O2-induced EAD and VF in 2 aged rat hearts by CaMKII inhibitor, KN-93 (1 μM). A: H2O2-mediated VF, which upon 20 min of KN-93 perfusion, the VF is suppressed in the continued presence of H2O2. Upon 30 min of KN-93 WO in the continued presence of H2O2, VF reemerges. B: prevention of VF emergence with KN-93 pretreatment 15 min before the start of H2O2 perfusion. H2O2 exposure for 45 min failed to induced VF; however, upon 40 min of KN-93 WO in the continued presence of H2O2, VF emerges.
Fig. 9.
Fig. 9.
Two-dimensional simulations in a tissue with progressive regional increase in the number of fibroblasts to myocyte gap junction couplings. A–C: voltage snapshots after a paced beat from the left border of the tissue (red) with central ellipse (site 2) representing the region of progressive increase in fibroblast to myocyte-coupling ratio (F/M). In A, only small amplitude nonpropagating EADs occur when F/M equals 1. Similar dynamic scenario is also observed when the F/M in the ellipse is raised to 3 as shown in C. After the pace beat, EADs die out locally. However, when the F/M is in the intermediate range (1.1; B), the EADs are now of higher amplitude that propagate and excite the adjacent cardiac tissue as triggered beats. (see supplemental schematic diagram).

References

    1. Anderson ME, Braun AP, Wu Y, Lu T, Wu Y, Schulman H, Sung RJ. KN-93, an inhibitor of multifunctional Ca++/calmodulin-dependent protein kinase, decreases early afterdepolarizations in rabbit heart. J Pharmacol Exp Ther 287: 996–1006, 1998 - PubMed
    1. Bolli R, Patel BS, Jeroudi MO, Lei EK, McCay PB. Demonstration of free radical generation in “stunned” myocardium of intact dogs with the use of the spin trap alpha-phenyl N-tert-butyl nitrone. J Clin Invest 82: 476–485, 1988 - PMC - PubMed
    1. Camelliti P, Devlin GP, Matthews KG, Kohl P, Green CR. Spatially and temporally distinct expression of fibroblast connexins after sheep ventricular infarction. Cardiovasc Res 62: 415–425, 2004 - PubMed
    1. Dudley SC, Jr, Hoch NE, McCann LA, Honeycutt C, Diamandopoulos L, Fukai T, Harrison DG, Dikalov SI, Langberg J. Atrial fibrillation increases production of superoxide by the left atrium and left atrial appendage: role of the NADPH and xanthine oxidases. Circulation 112: 1266–1273, 2005 - PubMed
    1. Erickson JR, Joiner ML, Guan X, Kutschke W, Yang J, Oddis CV, Bartlett RK, Lowe JS, O'Donnell SE, Aykin-Burns N, Zimmerman MC, Zimmerman K, Ham AJ, Weiss RM, Spitz DR, Shea MA, Colbran RJ, Mohler PJ, Anderson ME. A dynamic pathway for calcium-independent activation of CaMKII by methionine oxidation. Cell 133: 462–474, 2008 - PMC - PubMed

Publication types

MeSH terms