

Development of a novel output value for quantitative assessment in methylated DNA immunoprecipitation-CpG island microarray analysis
- PMID: 19767598
- PMCID: PMC2762412
- DOI: 10.1093/dnares/dsp017
Development of a novel output value for quantitative assessment in methylated DNA immunoprecipitation-CpG island microarray analysis
Abstract
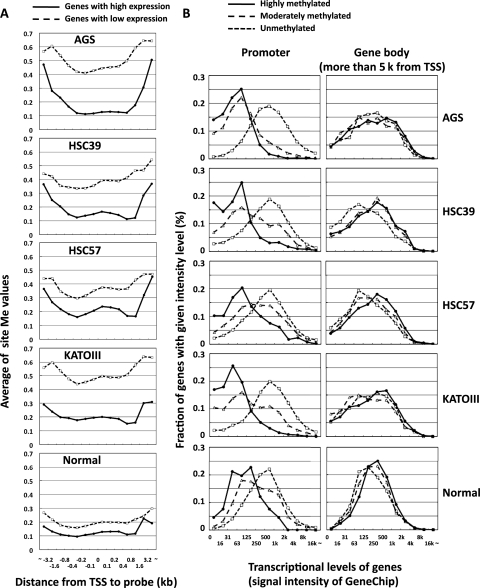
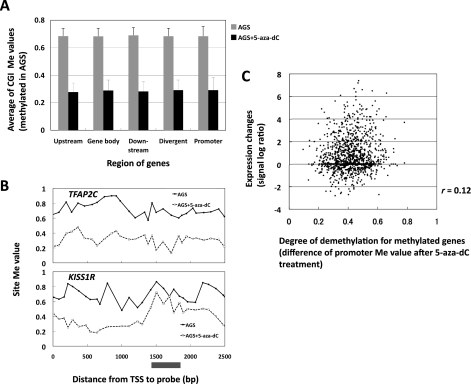
In DNA methylation microarray analysis, quantitative assessment of intermediate methylation levels in samples with various global methylation levels is still difficult. Here, specifically for methylated DNA immunoprecipitation-CpG island (CGI) microarray analysis, we developed a new output value. The signal log ratio reflected the global methylation levels, but had only moderate linear correlation (r = 0.72) with the fraction of DNA molecules immunoprecipitated. By multiplying the signal log ratio using a coefficient obtained from the probability value that took account of signals in neighbouring probes, its linearity was markedly improved (r = 0.94). The new output value, Me value, reflected the global methylation level, had a strong correlation also with the fraction of methylated CpG sites obtained by bisulphite sequencing (r = 0.88), and had an accuracy of 71.8 and 83.8% in detecting completely methylated and unmethylated CGIs. Analysis of gastric cancer cell lines using the Me value showed that methylation of CGIs in promoters and gene bodies was associated with low and high, respectively, gene expression. The degree of demethylation of promoter CGIs after 5-aza-2'-deoxycytidine treatment had no association with that of induction of gene expression. The Me value was considered to be useful for analysis of intermediate methylation levels of CGIs.
Figures
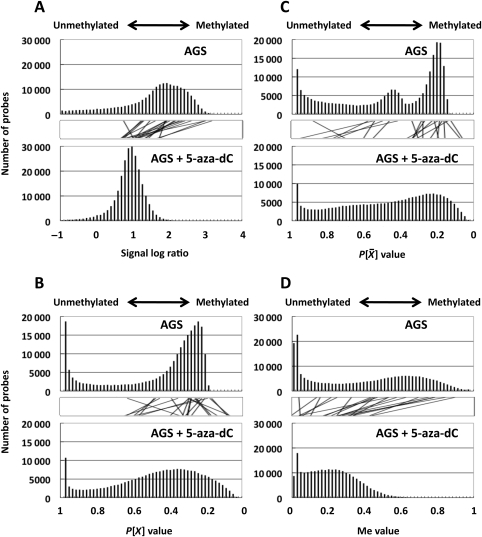
 value (C), and the Me value (D). Lines between the two bar graphs indicate values of individual probes (randomly selected representative 20 values). Distributions of the signal log ratio and the Me value reflected the global methylation level, as shown by their shift towards smaller values in cells with 5-aza-dC treatment. In contrast, those of the P[X] and P
 values did not show the shift.
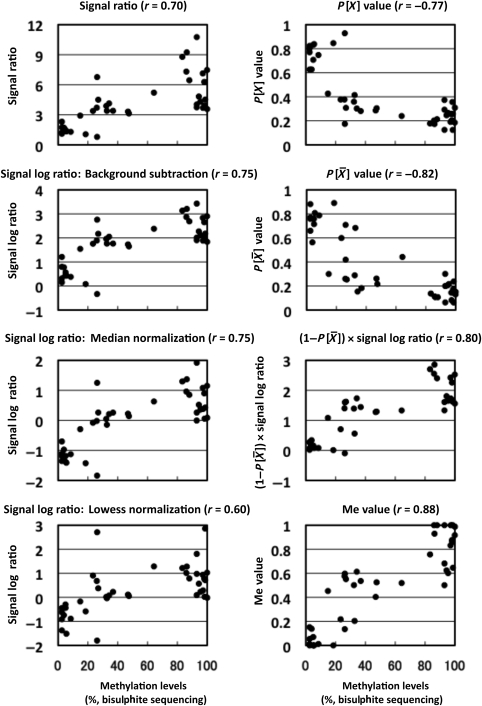
Similar articles
-
Genome-wide methylation and expression profiling identifies promoter characteristics affecting demethylation-induced gene up-regulation in melanoma.BMC Med Genomics. 2010 Feb 9;3:4. doi: 10.1186/1755-8794-3-4. BMC Med Genomics. 2010. PMID: 20144234 Free PMC article.
-
Methylation of neutral endopeptidase 24.11 promoter in rat hepatocellular carcinoma.Cancer Sci. 2006 Jul;97(7):611-7. doi: 10.1111/j.1349-7006.2006.00227.x. Cancer Sci. 2006. PMID: 16827801 Free PMC article.
-
Global demethylation of rat chondrosarcoma cells after treatment with 5-aza-2'-deoxycytidine results in increased tumorigenicity.PLoS One. 2009 Dec 17;4(12):e8340. doi: 10.1371/journal.pone.0008340. PLoS One. 2009. PMID: 20019818 Free PMC article.
-
Monitoring methylation changes in cancer.Adv Biochem Eng Biotechnol. 2007;104:1-11. doi: 10.1007/10_024. Adv Biochem Eng Biotechnol. 2007. PMID: 17290816 Review.
-
Decreased fidelity in replicating DNA methylation patterns in cancer cells leads to dense methylation of a CpG island.Curr Top Microbiol Immunol. 2006;310:199-210. doi: 10.1007/3-540-31181-5_10. Curr Top Microbiol Immunol. 2006. PMID: 16909912 Review.
Cited by
-
High-risk oral leukoplakia is associated with aberrant promoter methylation of multiple genes.BMC Cancer. 2016 Jun 3;16:350. doi: 10.1186/s12885-016-2371-5. BMC Cancer. 2016. PMID: 27255271 Free PMC article.
-
Transcriptome-wide mapping of 5-methylcytidine RNA modifications in bacteria, archaea, and yeast reveals m5C within archaeal mRNAs.PLoS Genet. 2013 Jun;9(6):e1003602. doi: 10.1371/journal.pgen.1003602. Epub 2013 Jun 27. PLoS Genet. 2013. PMID: 23825970 Free PMC article.
-
RhoA activity increases due to hypermethylation of ARHGAP28 in a highly liver-metastatic colon cancer cell line.Biomed Rep. 2016 Mar;4(3):335-339. doi: 10.3892/br.2016.582. Epub 2016 Jan 26. Biomed Rep. 2016. PMID: 26998271 Free PMC article.
-
Global methylation patterns in idiopathic pulmonary fibrosis.PLoS One. 2012;7(4):e33770. doi: 10.1371/journal.pone.0033770. Epub 2012 Apr 10. PLoS One. 2012. PMID: 22506007 Free PMC article.
-
Identification of gastric cancer risk markers that are informative in individuals with past H. pylori infection.Gastric Cancer. 2012 Oct;15(4):382-8. doi: 10.1007/s10120-011-0126-1. Epub 2012 Jan 12. Gastric Cancer. 2012. PMID: 22237657
References
-
- Jones P.A., Baylin S.B. The fundamental role of epigenetic events in cancer. Nat. Rev. Genet. 2002;3:415–28. - PubMed
-
- Robertson K.D. DNA methylation and human disease. Nat. Rev. Genet. 2005;6:597–610. - PubMed
-
- Suzuki M.M., Bird A. DNA methylation landscapes: provocative insights from epigenomics. Nat. Rev. Genet. 2008;9:465–76. - PubMed
Publication types
MeSH terms
Substances
LinkOut - more resources
Full Text Sources
Other Literature Sources
Molecular Biology Databases
