Three redox states of Trypanosoma brucei alternative oxidase identified by infrared spectroscopy and electrochemistry
- PMID: 19767647
- PMCID: PMC2797253
- DOI: 10.1074/jbc.M109.059980
Three redox states of Trypanosoma brucei alternative oxidase identified by infrared spectroscopy and electrochemistry
Abstract
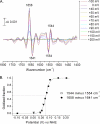
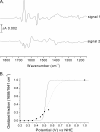
Electrochemistry coupled with Fourier transform infrared (IR) spectroscopy was used to investigate the redox properties of recombinant alternative ubiquinol oxidase from Trypanosoma brucei, the organism responsible for African sleeping sickness. Stepwise reduction of the fully oxidized resting state of recombinant alternative ubiquinol oxidase revealed two distinct IR redox difference spectra. The first of these, signal 1, titrates in the reductive direction as an n = 2 Nernstian component with an apparent midpoint potential of 80 mV at pH 7.0. However, reoxidation of signal 1 in the same potential range under anaerobic conditions did not occur and only began with potentials in excess of 500 mV. Reoxidation by introduction of oxygen was also unsuccessful. Signal 1 contained clear features that can be assigned to protonation of at least one carboxylate group, further perturbations of carboxylic and histidine residues, bound ubiquinone, and a negative band at 1554 cm(-1) that might arise from a radical in the fully oxidized protein. A second distinct IR redox difference spectrum, signal 2, appeared more slowly once signal 1 had been reduced. This component could be reoxidized with potentials above 100 mV. In addition, when both signals 1 and 2 were reduced, introduction of oxygen caused rapid oxidation of both components. These data are interpreted in terms of the possible active site structure and mechanism of oxygen reduction to water.
Figures


References
-
- Finnegan P. M., Soole K. L., Umbach A. L. (2004) Plant Mitochondria: From Genome To Function, p. 163, Kluwer Academic Publishers, Dordrecht, The Netherlands
-
- Berthold D. A., Stenmark P. (2003) Annu. Rev. Plant. Biol. 54, 497–517 - PubMed
-
- Affourtit C., Albury M. S., Crichton P. G., Moore A. L. (2002) FEBS Lett. 510, 121–126 - PubMed
-
- Moore A. L., Albury M. S., Crichton P. G., Affourtit C. (2002) Trends Plant Sci. 7, 478–481 - PubMed
-
- McDonald A. E., Vanlerberghe G. C. (2006) Comp. Biochem. Physiol. D 1, 357–364 - PubMed
Publication types
MeSH terms
Substances
Grants and funding
LinkOut - more resources
Full Text Sources

