. 2009 Oct;15(10):1186-94.
doi: 10.1038/nm.2029. Epub 2009 Sep 20.

Kcne2 deletion uncovers its crucial role in thyroid hormone biosynthesis

Affiliations

Kcne2 deletion uncovers its crucial role in thyroid hormone biosynthesis

Torsten K Roepke et al. Nat Med. 2009 Oct.

Abstract

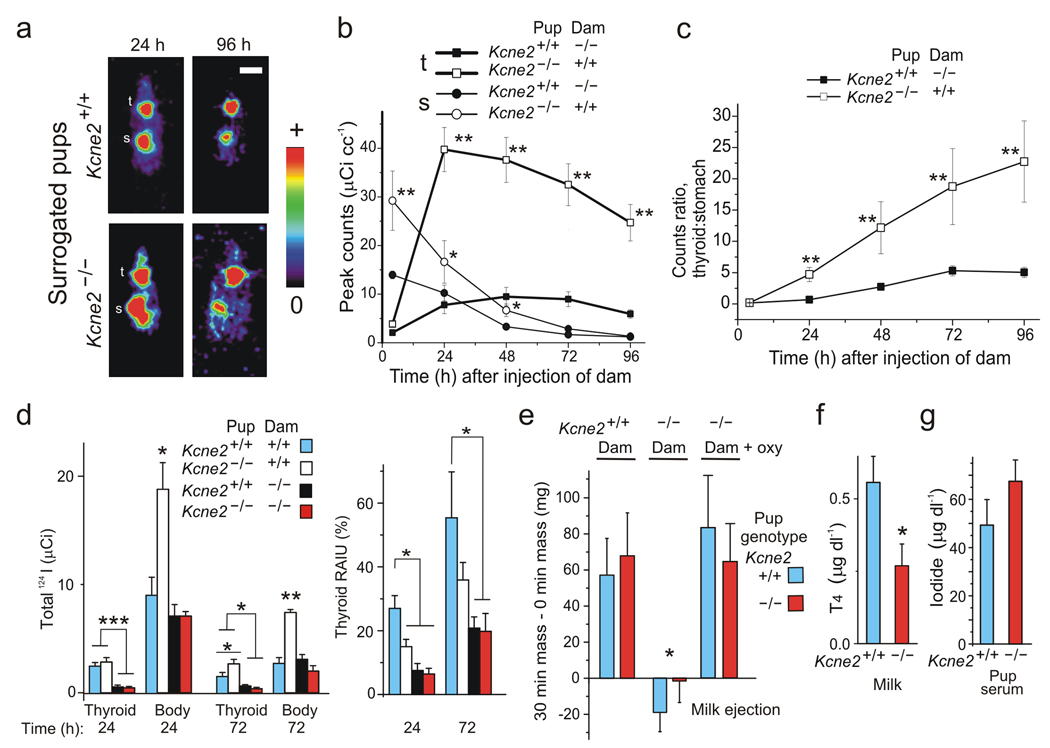
Thyroid dysfunction is a global health concern, causing defects including neurodevelopmental disorders, dwarfism and cardiac arrhythmia. Here, we show that the potassium channel subunits KCNQ1 and KCNE2 form a thyroid-stimulating hormone-stimulated, constitutively active, thyrocyte K+ channel required for normal thyroid hormone biosynthesis. Targeted disruption of Kcne2 in mice impaired thyroid iodide accumulation up to eightfold, impaired maternal milk ejection, halved milk tetraiodothyronine (T4) content and halved litter size. Kcne2-deficient mice had hypothyroidism, dwarfism, alopecia, goiter and cardiac abnormalities including hypertrophy, fibrosis, and reduced fractional shortening. The alopecia, dwarfism and cardiac abnormalities were alleviated by triiodothyronine (T3) and T4 administration to pups, by supplementing dams with T(4) before and after they gave birth or by feeding the pups exclusively from Kcne2+/+ dams; conversely, these symptoms were elicited in Kcne2+/+ pups by feeding exclusively from Kcne2-/- dams. These data provide a new potential therapeutic target for thyroid disorders and raise the possibility of an endocrine component to previously identified KCNE2- and KCNQ1-linked human cardiac arrhythmias.


Figures

Figure 1
Figure 1. Kcne2 disruption causes cardiac hypertrophy, fibrosis and reduced fractional shortening
(a) Left, external view of exemplar hearts from 3-week-old Kcne2+/+ (left) and Kcne2−/− (right) mice from homozygous crosses. Right, mean heart mass, body mass, and heart weight/bodyweight (HW/BW; mg g−1) for mice as in panel a (n = 9–14).* P < 0.000001. (b)Exemplar transthoracic echocardiograms for a 3-week-old Kcne2+/+ pup from a Kcne2+/+ dam and a Kcne2−/− pup from a Kcne2−/− dam. (c) Mean echocardiographic parameters from recordings as in panel b. d/s, diastolic/systolic; LVAW, left ventricular anterior wall thickness; LVID, left ventricular internal diameter; LVPW, left ventricular posterior wall thickness, n = 4 per group. * P < 0.05; ** P < 0.005; *** P < 0.0005, by one-way ANOVA. (d) Left, mean cell capacitance for ventricular myocytes isolated from 3-week-old pups from homozygous crosses, n = 6–8; *P < 0.001. Right, exemplar whole-cell recordings from ventricular myocytes as in left. Insets: voltage protocol and scale bars. (e) Mean peak current densities for Kcne2+/+ (blue) and Kcne2−/− (red) myocytes as in panel d, n = 6–8; *P < 0.05. (f) Left, current inactivation τ values for Kcne2+/+ (blue) versus Kcne2−/− (red) myocytes as in panel e. Right, current amplitudes from double exponential fits for Kcne2+/+ (solid) versus Kcne2−/− (open) myocytes as in panel g. *P < 0.001. Current decay was best fit with two exponentials with parameters resembling Ito,f and IK,slow, and a steady-state current, Iss. (g–i) Cardiac tissue from 3-week-old Kcne2−/− mice bred from Kcne2−/− dams. (g) Exemplar necropsy. (h) Left, exemplar Masson’s trichrome-stained left ventricle showing collagen (blue) indicative of fibrosis. Scale bar, 150 µm. Right, exemplar H&E-stained papillary muscle. Scale bar, 30 µm. (i) Exemplar Masson’s trichrome stained liver showing marked perisinusoidal fibrosis (blue). Scale bar, 200 µm. (j) Cardiac tissue from 15-month-old Kcne2−/− mice bred from Kcne2+/− dams; similar results were observed in 4/4 mice evaluated. Left, exemplar necropsy showing cardiomegaly; center and right, exemplar Masson’s trichrome-stained LV showing fibrosis (blue). Scale bars: center, 100 µm; right, 30 µm.
Figure 2
Figure 2. Kcne2 disruption causes embryonic lethality, dwarfism and alopecia
(a) Left, mean live births per litter for wild-type and Kcne2-disrupted crosses as indicated; n = 19–50 litters per group. *P<0.01. Right, genotype of surviving pups (%). n shown in parentheses. (b) Exemplar 3-week-old pups from Kcne2−/− × Kcne2−/− and Kcne2+/+ × Kcne2+/+ crosses. (c) Exemplar X-ray images of 5-week-old pups from Kcne2−/− × Kcne2−/− and Kcne2+/+ × Kcne2+/+ crosses. (d) Mean body mass at 3–6 weeks of age for pups from wild-type and Kcne2-disrupted crosses as indicated; n = 15–50 pups per group. *P<0.05. (e) Exemplar 5-week-old Kcne2+/+ and Kcne2−/− mice from homozygous crosses. (f) Exemplar close-up views of skin from mice as in panel e. (g) Exemplar micrographs of H&E-stained dermis sections from Kcne2−/− mouse as in panel e. Scale bar = 300 µm. (h) Exemplar 1-year-old Kcne2+/+ and Kcne2−/− mice from Kcne2+/− × Kcne2+/− crosses. (i) Exemplar micrograph of H&E-stained dermis sections from Kcne2−/− mouse in panel i. inset, detail from boxed region, showing border zone between normal hair and alopecia, with abrupt cessation of mature hair follicles. Scale bar = 600 µm. (j) H&E-stained sections showing hair follicles in dermis from Kcne2+/+ and Kcne2−/− mice as in panel i. Scale bars = 20 µm.
Figure 3
Figure 3. Kcne2−/− mice are hypothyroid and treatable with T3/T4 or wild-type surrogacy
(a) Left, Serum T4 in Kcne2+/+ & Kcne2−/− mice at 3 wks. Right, serum TSH in Kcne2+/+ & Kcne2−/− mice at 3 wks. *significantly different from Kcne2+/+ by ANOVA, P < 0.001. Numbers in parentheses indicate n. (b) Mean mass of thyroid glands from 12 month old Kcne2+/+, +/− and −/− mice from Kcne2+/− × Kcne2+/− crosses, weighed most-mortem, numbers in parentheses indicate n. Significant differences: * P < 0.005; ** P < 1 × 10⁻⁴; ***P < 1 × 10⁻⁹. (c) Serum T4 in pregnant Kcne2+/+ & Kcne2−/− mice. *significantly different from Kcne2+/+, P < 0.001. (d) Exemplar 3-week-old pups from homozygous crosses surrogated (Sgt) with dams of opposite genotype (e) Mean body mass at 3–6 weeks of age for pups from wild-type and Kcne2-disrupted crosses surrogated (Sgt), or treated (Tx) with T3/T4 injection (P) or by T4 supplementation of their mothers (D); n = 9–23 pups per group. Untreated groups (/) from Figure 2 d shown for comparison. (f) Exemplar 12-week-old Kcne2−/− mouse before (left) and after (right) 10 days QOD T3/T4 administration. Results were consistent in 5/5 mice evaluated. (g) Left, histology of mouse in panel f after T3/T4 treatment showing recovery of normal hair follicles. Scale bar = 200 µm. Right, percentage of mice with normal hair growth grouped according to parental genotype. Groups were untreated (/), surrogated (Sgt) with dams (genotype as indicated) or treated (Tx) directly by QOD T3/T4injection (P) or by T4 supplementation of their mothers (D); n = 16–23 mice per group. (h) Exemplar necropsies of 3-week-old Kcne2+/+ and Kcne2−/− mice bred from homozygous crosses, with/without surrogacy with mothers of opposite genotype. (i) Mean heart weight/bodyweight (HW/BW; mg/g) for mice as in panel h, n = 7–9. *P<0.05 compared to values for non-surrogated pups (taken from Fig. 1c, key in Fig. 3j). (j) Mean echocardiographic parameters for 3-week-old Kcne2+/+ and Kcne2−/− mice bred from homozygous crosses, with/without surrogacy with mothers of opposite genotype. d/s, diastolic/systolic; LVAW, left ventricular anterior wall thickness; LVID, left ventricular internal diameter; LVPW, left ventricular posterior wall thickness, n = 5 mice. *P<0.05 compared to values for non-surrogated pups (taken from Fig. 1c).
Figure 4
Figure 4. KCNE2 and KCNQ1 form a TSH-stimulated thyrocyte K+ channel
(a) Immunofluorescence using antibodies raised against KCNE2, KCNQ1 and NIS in human thyrocytes in sections from individuals with Grave’s Disease. DAPI visualization of nuclei shown in blue. *Colloid. Scale bars: 4 µm. (b) Western immunoblots (IB) using antibodies raised against KCNE2 (arrows indicate the three glycosylation states of KCNE2) and KCNQ1 (lower arrow, monomer; upper arrow, multimer) in thyroid tissue from Kcne2+/+ and Kcne2−/− mice (from Kcne2+/− × Kcne2+/− crosses). (c) Immunofluorescence using antibodies raised against KCNE2, KCNQ1 and NIS, in thyrocytes of 3-month-old Kcne2+/+ mice (from Kcne2+/− × Kcne2+/− crosses). *Colloid. Scale bars: 4 −µm. (d) Immunofluorescence using antibodies raised against KCNE2 and KCNQ1, in thyrocytes of 3-monthold Kcne2−/− mice (from Kcne2+/− × Kcne2+/− crosses). *Colloid. Scale bars: 4 µm. (e) H & E staining of adult Kcne2+/+ and Kcne2−/− thyroid glands (from Kcne2+/− × Kcne2+/− crosses); scale bars, 20 µm. (f) Electron micrographs of thyroid epithelium from adult Kcne2+/+ and Kcne2−/− mice (from Kcne2+/− × Kcne2+/− crosses). Scale bars, 2 µm. (g) Western blots of membrane fractions from FRTL5 cells with and without 10 hours incubation with cAMP, using antibodies raised against KCNE2 (arrows putatively indicate the three predicted glycosylation states); and FRTL5 cells with and without 6 days TSH incubation, using antibodies raised against KCNQ1 (lower arrow, monomer; upper arrow, tetramer). (h) Exemplar whole-cell patch-clamp recordings of XE991-sensitive currents in FRTL5 cells with or without TSH incubation. Upper left inset: voltage protocol. Zero current level indicated by dashed line. (i) Mean whole-cell total (n = 9–16) and XE991-sensitive (n = 8–9) current relationships for FRTL5 cells with or without TSH incubation. Significant difference: *P < 0.05.
Figure 5
Figure 5. Kcne2 is required for normal thyroid I accumulation
(a) Exemplar microPET images of lactating Kcne2+/+ and Kcne2−/− dams recorded during the first hour after tail vein injection of 124I. Labels: t, thyroid; m, mammary glands. Color intensity scale on right, showing red indicates highest intensity. Scale bar (white) = 5 mm. (b) Mean 124I accumulation in thyroid relative to mammary gland from imaging as in panel a, n = 4 mice per group, error bars indicate SEM. Measured as ratio of maximum radioactivity in each tissue minus mean background count in each mouse. *P<1×10⁻⁸. (c) Mean 124I accumulation in thyroid relative to mammary gland as in panel a but from 1–72 hours after tail vein injection of 124I, n = 4–5 mice per group, error bars indicate SEM. *P<0.05. (d) Exemplar microPET images of pre-weaning Kcne2+/+ and Kcne2−/− pups recorded 24–72 hours after their mothers (same dams as in panels a–c) received tail vein injections of 124I. Labels: t, thyroid; s, stomach. Intensity scale as in panel a. Scale bar (white) = 5 mm. (e) Mean 124I accumulation (in µCi) in thyroid and stomach from imaging as in panel d, n = 7–12 pups per time-point per group, error bars indicate SEM. Measured as maximum radioactivity in each tissue minus mean background count in each mouse. *P<0.05. (f) Mean 124I accumulation in thyroid relative to stomach, imaging method and pups as in panel e. Measured as ratio of maximum radioactivity in each tissue minus mean background count in each mouse. *P<0.0005.
Figure 6
Figure 6. Kcne2−/− dams have a milk ejection defect and produce low-T4 milk
(a) Exemplar microPET images of pre-weaning Kcne2+/+ and Kcne2−/− pups recorded 24–96 hours after their surrogate mothers of opposite genotype received tail vein injections of 124I. Labels: t, thyroid; s, stomach. Intensity scale shown on right. Scale bar (white) = 10 mm. (b) Mean peak 124I accumulation (measured as peak µCi cc−1) in thyroid and stomach from imaging as in panel a, n = 7–12 pups per time-point per group, error bars indicate SEM. Measured as maximum radioactivity in each tissue minus mean background count in each mouse. *P<0.05; **P<0.01. (c) Mean peak 124I accumulation in thyroid relative to stomach, imaging method and pups as in panel a. Measured as ratio of maximum radioactivity in each tissue minus mean background count in each mouse. **P<0.001. (d) Effects of pup and dam genotype on pup total thyroid and body 124I accumulation (left), and thyroid RAIU (radioactive iodide uptake as a percentage of total body radioiodine) (right), determined using 3D regions of interest from PET analyses of pup 124I accumulation (surrogated and non-surrogated) after tail vein injection of dams; n = 7–12. *P<0.05; **P<0.005; ***P<0.0005. (e) Milk ejection assay. Mean mass of pups before (0 min) and after 30 min feeding period; n = 8–20; *P<0.01. ‘oxy’ indicates dams injected with oxytocin 10 minutes prior to feeding period. (f) Milk T4 concentration; n = 5–7; *P<0.05. (g) Plasma I concentration in 3-week-old pups; n = 6 per genotype.

References

    1. Barhanin J, et al. K(V)LQT1 and lsK (minK) proteins associate to form the I(Ks) cardiac potassium current. Nature. 1996;384:78–80. - PubMed
    1. Sanguinetti MC, et al. Coassembly of K(V)LQT1 and minK (IsK) proteins to form cardiac I(Ks) potassium channel. Nature. 1996;384:80–83. - PubMed
    1. Splawski I, Tristani-Firouzi M, Lehmann MH, Sanguinetti MC, Keating MT. Mutations in the hminK gene cause long QT syndrome and suppress IKs function. Nat Genet. 1997;17:338–340. - PubMed
    1. Tyson J, et al. IsK and KvLQT1: mutation in either of the two subunits of the slow component of the delayed rectifier potassium channel can cause Jervell and Lange-Nielsen syndrome. Hum Mol Genet. 1997;6:2179–2185. - PubMed
    1. McDonald TV, et al. A minK-HERG complex regulates the cardiac potassium current I(Kr) Nature. 1997;388:289–292. - PubMed

MeSH terms