. 2010 Mar;4(1):37-59.
doi: 10.1007/s11571-009-9092-2. Epub 2009 Sep 19.

Effects of the anesthetic agent propofol on neural populations

Effects of the anesthetic agent propofol on neural populations

Axel Hutt et al. Cogn Neurodyn. 2010 Mar.

Abstract

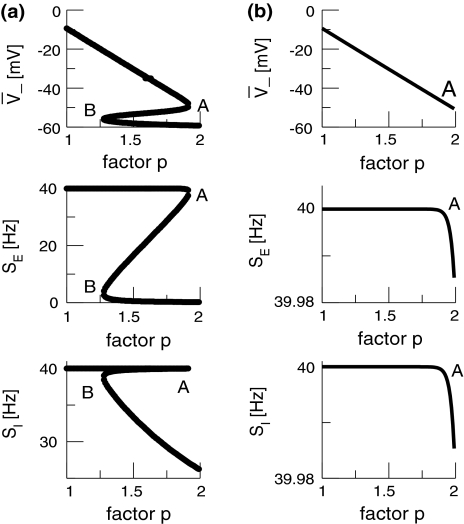
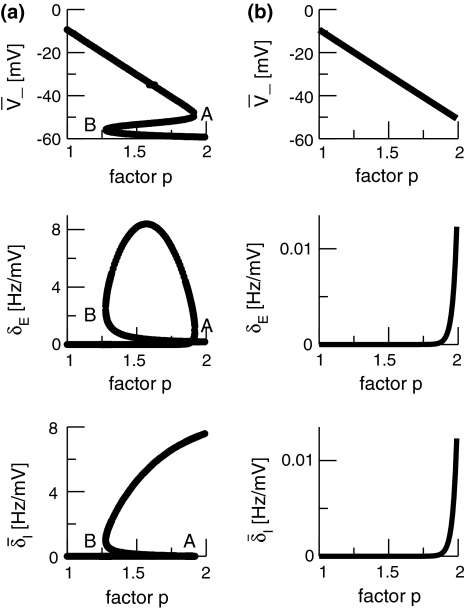
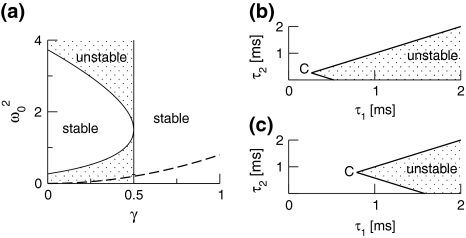
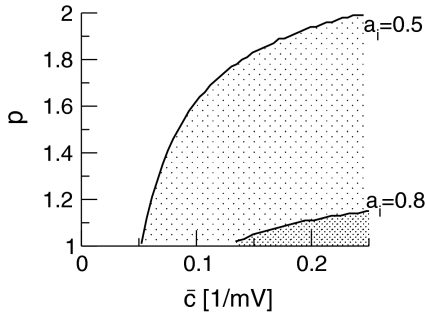
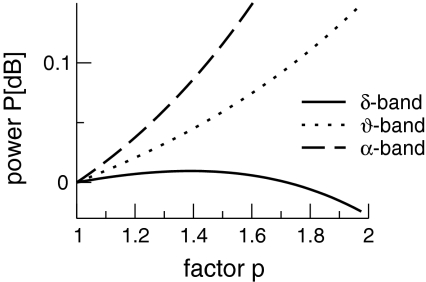
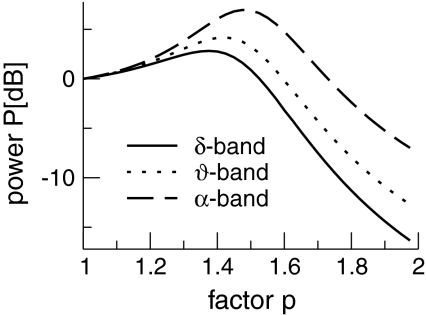
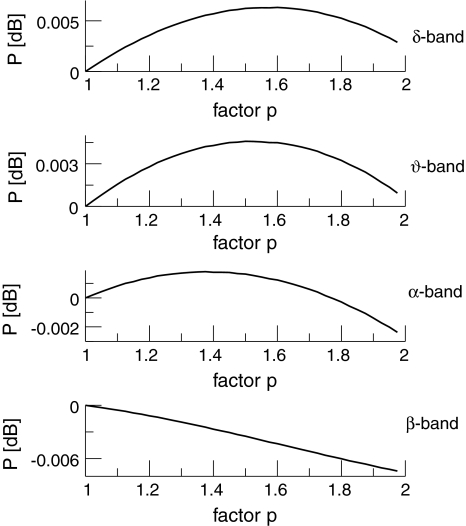
The neuronal mechanisms of general anesthesia are still poorly understood. Besides several characteristic features of anesthesia observed in experiments, a prominent effect is the bi-phasic change of power in the observed electroencephalogram (EEG), i.e. the initial increase and subsequent decrease of the EEG-power in several frequency bands while increasing the concentration of the anaesthetic agent. The present work aims to derive analytical conditions for this bi-phasic spectral behavior by the study of a neural population model. This model describes mathematically the effective membrane potential and involves excitatory and inhibitory synapses, excitatory and inhibitory cells, nonlocal spatial interactions and a finite axonal conduction speed. The work derives conditions for synaptic time constants based on experimental results and gives conditions on the resting state stability. Further the power spectrum of Local Field Potentials and EEG generated by the neural activity is derived analytically and allow for the detailed study of bi-spectral power changes. We find bi-phasic power changes both in monostable and bistable system regime, affirming the omnipresence of bi-spectral power changes in anesthesia. Further the work gives conditions for the strong increase of power in the δ-frequency band for large propofol concentrations as observed in experiments.


Figures

Fig. 1
Fig. 1
Extraction of the charge transfer curve from experimental data (Fig. 6 in [Kitamura et al. 2002)] subjected to the factor p. a The experimentally measured mean (circles) percentile increase of the inhibitory decay time p = (1/β1)/(1/β10), their maximum (squares) and minimum (diamonds) values at the error interval borders and the corresponding fitted functions (15) (dashed line for maximum values, dashed-dotted line for the mean value and dotted line for the minimum values). b The experimentally measured mean (circles) percentile increase of the charge transfer ρ(c)/ρ(0), their maximum (squares) and minimum (diamonds) values at the error interval borders and the corresponding functions (16). The line coding is the same as in a. c The calculated relation (17) for the mean values, the lower and upper value border and the model (14) (red solid line). The line coding is the same as in a
Fig. 2
Fig. 2
The temporal impulse response function hi(t) of inhibitory GABAA-synapses subject to various values of p taken from (3) and (14). Parameters are set to β10 = 75 Hz, β2 = 1,000 Hz (Koch 1999)
Fig. 3
Fig. 3
Construction of solutions of Eq. 18 for equal constants ce = ci and various firing thresholds Θei. The panels show the left hand side of (18), i.e. formula image encoded as the thin dashed diagonal, and the right hand side of (18), i.e. formula image decoded as thick solid lines. The plots are given for three parameters p1 < p2 < p3. The vertical coordinates of the curve points are the values of the left and right hand side of (18) and the horizontal coordinate is formula image By this graphical construction, the crossing points of the dashed line and the solid line give the stationary solutions formula image In a the firing threshold of excitatory neurons ΘE is lower than the threshold of inhibitory neurons ΘI, b shows the case ΘE = ΘI, c ΘE > ΘI and d ΘE ≫ ΘI
Fig. 4
Fig. 4
Construction of solutions of Eq. 18 for equal firing thresholds Θe = Θi = Θ and different constants ce, ci. The panels show the left hand side (thin dashed diagonal) and the right hand side (thick solid lines) of (18) for three parameters p1 < p2 < p3. The crossing points of the dashed line and the solid line give the stationary solutions formula image (a) illustrates the case ce < ci, (b) ce = ci, (c) ce > ci and (d) ce ≫ ci
Fig. 5
Fig. 5
The stationary solutions formula image of Eq. 18, the firing rates of excitatory and inhibitory neurons SE = SE(V − ΘE) and SI = SI(V − ΘI), respectively, for the triple (left) and the single (right) solution case. a ΘE > ΘI, ce = ci, b ΘE = ΘI,ce = ci. The specific parameters are a ΘE = −53 mV, ΘI = −60 mV, ce = ci = 0.84/mV, b ΘE = ΘI = −60 mV, ce = ci = 0.24/mV. Additional parameters are given in section "Methods"
Fig. 6
Fig. 6
The nonlinear gains of excitatory and inhibitory neurons δE(p) and formula image respectively. a ΘE > ΘI, ce = ci, b ΘE = ΘI, ce = ci. In a the points A and B denote the saddle-node bifurcation points (top panel), represents the right (A) and left (B) turning points of δE where dδE/dp → ∞ (center panel). In addition in the bottom panel A and B mark the values of formula image corresponding to the top and center panel. The parameters are taken from Fig. 5
Fig. 7
Fig. 7
Stability regimes of the resting state at p = 1, i.e. prior to the administration of propofol. a The stable regime is given by Eq. 30 for γ < 1/2, while γ ≥ 1/2 leads to stability for all ω02. The specific result β2 ≈ 8.5β1 yields the specific solutions (31) represented by the dashed line: for γ < 1/2 the solutions are unstable and for γ ≥ 1/2 they are stable. b, c show the stability regime with respect to the excitatory time scales τ1, τ2 for the specific case β2 = 8.5β1 according to Eq. 32. The border point C is located at τ1 = τ2 = η1/38. b η1 = 10ms, c η1 = 30ms.
Fig. 8
Fig. 8
Parameter regime of power enhancement for single stationary solutions. The shaded areas give the parameter regime for p and formula image where the power is enhanced in the δ-frequency band. Parameters are ae = 1.0mVs, ΘE = ΘI = −60mV, with other parameters taken from section "Methods"
Fig. 9
Fig. 9
The spectral power in different frequency bands in the single solution case. p is the power enhancement and defined as p = 10log10 (PEEG(ν)/PEEG(0)). The frequency bands are defined in the intervals [0.1 Hz;4 Hz] (δ-band), [4 Hz;8 Hz] (θ-band) and [8 Hz;12 Hz] (α-band). Here ce = ci = 0.06/mV and other parameters are taken from Fig. 8 and section "Methods"
Fig. 10
Fig. 10
The parameter regime of power enhancement at low frequencies for triple solutions according to Eq. 49. Here the upper branch of stationary solutions is considered. The corresponding regimes lie above the corresponding lines. The shaded areas give the parameter regime of η and formula image where the power is enhanced in the δ-frequency band. Here ae = 1.0 mVs and other parameters are taken from section "Methods"
Fig. 11
Fig. 11
The spectral power enhancement on the top branch of the triple stationary solutions. The definition of p and the frequency bands are given in Fig. 9. Parameters are ΘE = −50 mV, ΘI = −60 mV, ce = ci = 0.114/mV, others are taken from Fig. 10
Fig. 12
Fig. 12
The spectral power of the single solution case with respect to p. The definition of P and the frequency bands are taken from Fig. 9. Parameters are ΘE = ΘI = −60 mV, ce = ci = 0.038/mV, ae = 1.0 mVs, ai = 0.2 mVs, β2 = 5780 Hz, β1 = 680 Hz, others are taken from Fig. 8

References

    1. Agmon-Sir H, Segev I. Signal delay and input synchronisation in passive dendritic structures. J Neurophysiol. 1993;70:2066–2085. - PubMed
    1. Alkire M, Hudetz A, Tononi G. Consciousness and anesthesia. Science. 2008;322:876–880. doi: 10.1126/science.1149213. - DOI - PMC - PubMed
    1. Amari S. Dynamics of pattern formation in lateral-inhibition type neural fields. Biol Cybern. 1977;27:77–87. doi: 10.1007/BF00337259. - DOI - PubMed
    1. Amit DJ. Modeling brain function: the world of attactor neural networks. Cambridge: Cambridge University Press; 1989.
    1. Andrews D, Leslie K, Sessler D, Bjorksten A. The arterial blood propofol concentration preventing movement in 50% of healthy women after skin incision. Anesth Analg. 1997;85:414–419. doi: 10.1097/00000539-199708000-00030. - DOI - PubMed