

KING (Kinemage, Next Generation): a versatile interactive molecular and scientific visualization program
- PMID: 19768809
- PMCID: PMC2788294
- DOI: 10.1002/pro.250
KING (Kinemage, Next Generation): a versatile interactive molecular and scientific visualization program
Abstract
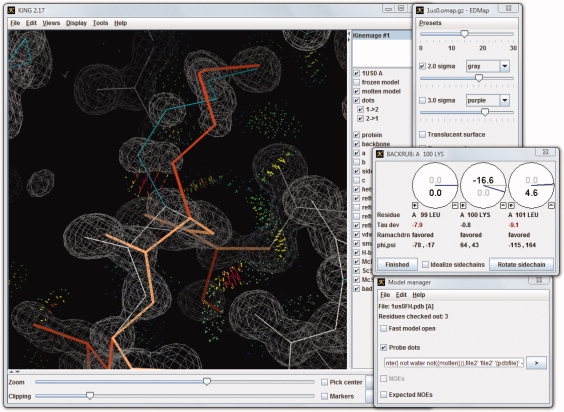
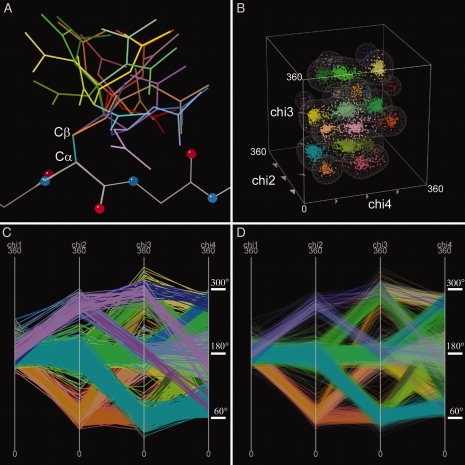
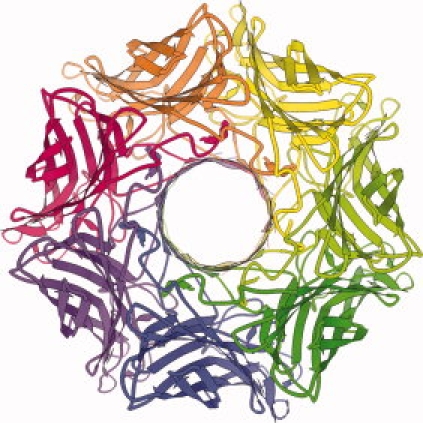
Proper visualization of scientific data is important for understanding spatial relationships. Particularly in the field of structural biology, where researchers seek to gain an understanding of the structure and function of biological macromolecules, it is important to have access to visualization programs which are fast, flexible, and customizable. We present KiNG, a Java program for visualizing scientific data, with a focus on macromolecular visualization. KiNG uses the kinemage graphics format, which is tuned for macromolecular structures, but is also ideal for many other kinds of spatially embedded information. KiNG is written in cross-platform, open-source Java code, and can be extended by end users through simple or elaborate "plug-in" modules. Here, we present three such applications of KiNG to problems in structural biology (protein backbone rebuilding), bioinformatics of high-dimensional data (e.g., protein sidechain chi angles), and classroom education (molecular illustration). KiNG is a mature platform for rapidly creating and capitalizing on scientific visualizations. As a research tool, it is invaluable as a test bed for new methods of visualizing scientific data and information. It is also a powerful presentation tool, whether for structure browsing, teaching, direct 3D display on the web, or as a method for creating pictures and videos for publications. KiNG is freely available for download at http://kinemage.biochem.duke.edu.
Figures
References
-
- DeLano WL. 2002. http://www.pymol.org) The PyMOL molecular graphics system on world wide web.
-
- Guex N, Peitsch MC. SWISS-MODEL and the Swiss-PdbViewer: an environment for comparative protein modeling. Electrophoresis. 1997;18:2714–2723. - PubMed
-
- Pettersen EF, Goddard TD, Huang CC, Couch GS, Greenblatt DM, Meng EC, Ferrin TE. UCSF chimera—a visualization system for exploratory research and analysis. J Comp Chem. 2004;25:1605–1612. - PubMed
-
- Sayle R. 1992. RasMol: a program for fast realistic rendering of molecular structures with shadows. Proceedings of the 10th Eurographics UK '92 Conference. York, UK, University of Edinburgh, Scotland: Abingdon Press.
-
- Jmol: an open-source Java viewer for chemical structures in 3D. http://www.jmol.org/
Publication types
MeSH terms
Grants and funding
LinkOut - more resources
Full Text Sources
Other Literature Sources
Research Materials
