

Human population growth and the demographic transition
- PMID: 19770150
- PMCID: PMC2781829
- DOI: 10.1098/rstb.2009.0137
Human population growth and the demographic transition
Abstract
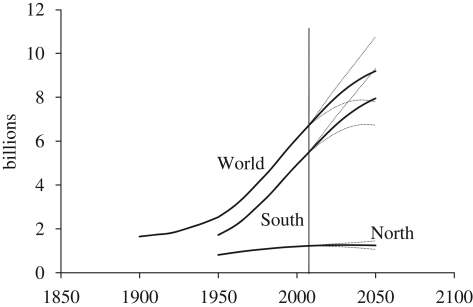
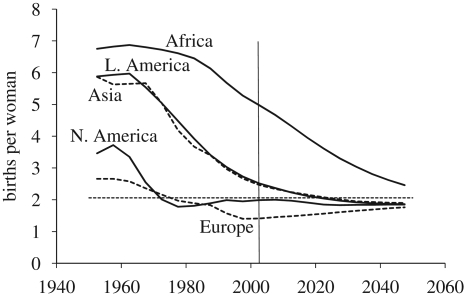
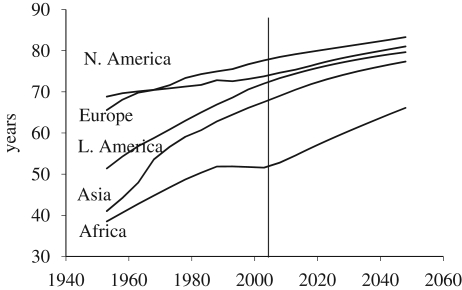
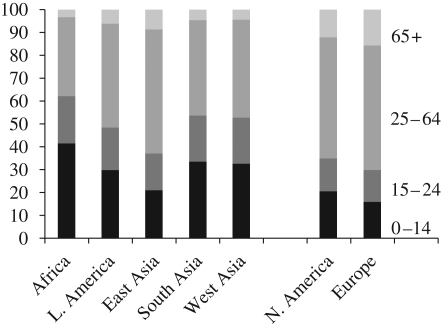
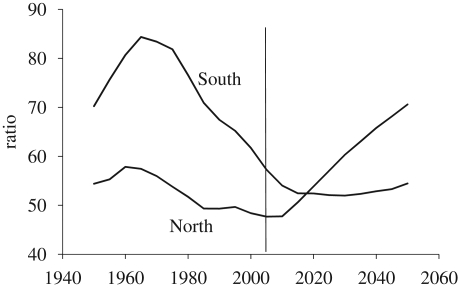
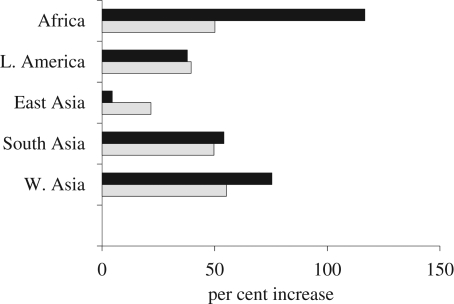
The world and most regions and countries are experiencing unprecedentedly rapid demographic change. The most obvious example of this change is the huge expansion of human numbers: four billion have been added since 1950. Projections for the next half century expect a highly divergent world, with stagnation or potential decline in parts of the developed world and continued rapid growth in the least developed regions. Other demographic processes are also undergoing extraordinary change: women's fertility has dropped rapidly and life expectancy has risen to new highs. Past trends in fertility and mortality have led to very young populations in high fertility countries in the developing world and to increasingly older populations in the developed world. Contemporary societies are now at very different stages of their demographic transitions. This paper summarizes key trends in population size, fertility and mortality, and age structures during these transitions. The focus is on the century from 1950 to 2050, which covers the period of most rapid global demographic transformation.
Figures
References
-
- Birdsall N., Kelley A., Sinding S.2001Population matters: demographic change, economic growth and poverty in the developing world Oxford, UK: Oxford University Press
-
- Bongaarts J., Bulatao R.1999Completing the demographic transition. Popul. Dev. Rev. 25, 515–529 (doi:10.1111/j.1728-4457.1999.00515.x) - DOI
-
- Bongaarts J., Buettner J., Heilig G., Pelletier F.2008Has the AIDS epidemic peaked? Popul. Dev. Rev. 34, 199–224 (doi:10.1111/j.1728-4457.2008.00217.x) - DOI
-
- National Research Council 2000Beyond six billion: forecasting the world's population (eds Bongaarts J., Bulatao R.). Washington, DC: National Academy Press
-
- OECD 1998Maintaining prosperity in an ageing society Paris: OECD Publications
Publication types
MeSH terms
LinkOut - more resources
Full Text Sources
Miscellaneous