

In-depth qualitative and quantitative profiling of tyrosine phosphorylation using a combination of phosphopeptide immunoaffinity purification and stable isotope dimethyl labeling
- PMID: 19770167
- PMCID: PMC2808269
- DOI: 10.1074/mcp.M900291-MCP200
In-depth qualitative and quantitative profiling of tyrosine phosphorylation using a combination of phosphopeptide immunoaffinity purification and stable isotope dimethyl labeling
Abstract
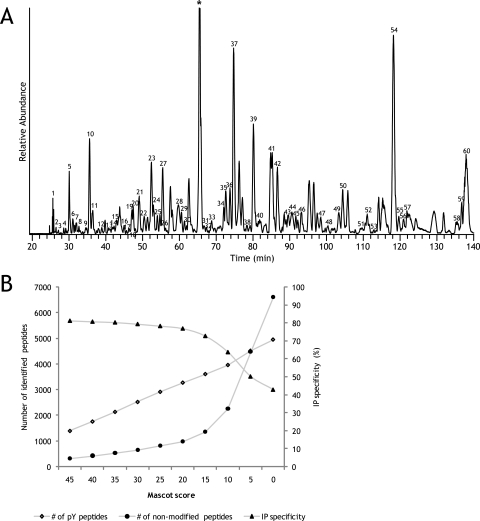
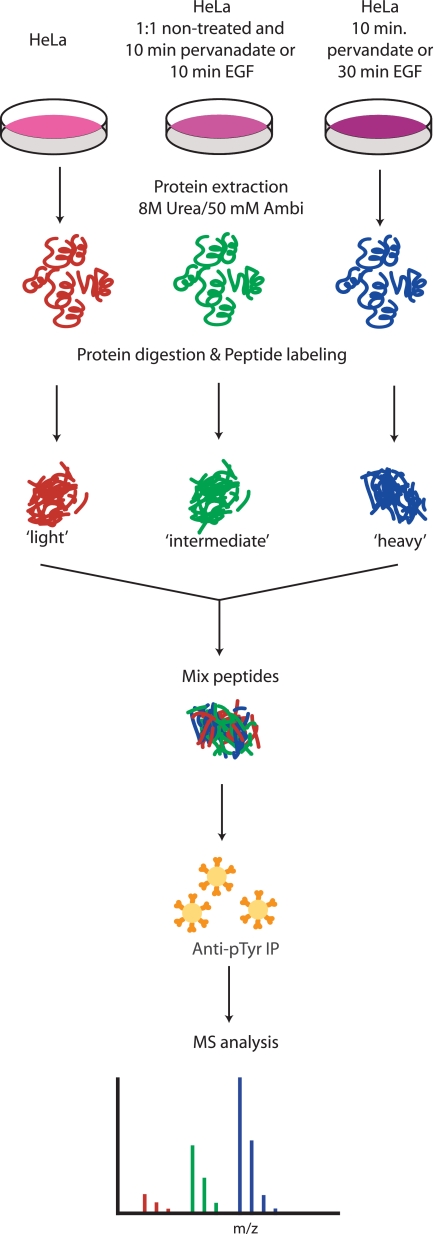
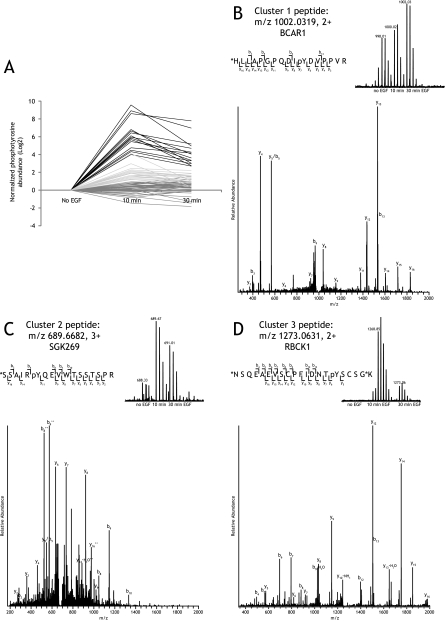
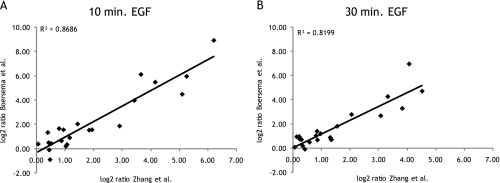
Several mass spectrometry-based assays have emerged for the quantitative profiling of cellular tyrosine phosphorylation. Ideally, these methods should reveal the exact sites of tyrosine phosphorylation, be quantitative, and not be cost-prohibitive. The latter is often an issue as typically several milligrams of (stable isotope-labeled) starting protein material are required to enable the detection of low abundance phosphotyrosine peptides. Here, we adopted and refined a peptidecentric immunoaffinity purification approach for the quantitative analysis of tyrosine phosphorylation by combining it with a cost-effective stable isotope dimethyl labeling method. We were able to identify by mass spectrometry, using just two LC-MS/MS runs, more than 1100 unique non-redundant phosphopeptides in HeLa cells from about 4 mg of starting material without requiring any further affinity enrichment as close to 80% of the identified peptides were tyrosine phosphorylated peptides. Stable isotope dimethyl labeling could be incorporated prior to the immunoaffinity purification, even for the large quantities (mg) of peptide material used, enabling the quantification of differences in tyrosine phosphorylation upon pervanadate treatment or epidermal growth factor stimulation. Analysis of the epidermal growth factor-stimulated HeLa cells, a frequently used model system for tyrosine phosphorylation, resulted in the quantification of 73 regulated unique phosphotyrosine peptides. The quantitative data were found to be exceptionally consistent with the literature, evidencing that such a targeted quantitative phosphoproteomics approach can provide reproducible results. In general, the combination of immunoaffinity purification of tyrosine phosphorylated peptides with large scale stable isotope dimethyl labeling provides a cost-effective approach that can alleviate variation in sample preparation and analysis as samples can be combined early on. Using this approach, a rather complete qualitative and quantitative picture of tyrosine phosphorylation signaling events can be generated.
Figures
Similar articles
-
SPECHT - single-stage phosphopeptide enrichment and stable-isotope chemical tagging: quantitative phosphoproteomics of insulin action in muscle.J Proteomics. 2015 Jan 30;114:48-60. doi: 10.1016/j.jprot.2014.11.001. Epub 2014 Nov 9. J Proteomics. 2015. PMID: 25463755 Free PMC article.
-
Combining Metabolic ¹⁵N Labeling with Improved Tandem MOAC for Enhanced Probing of the Phosphoproteome.Methods Mol Biol. 2015;1306:81-96. doi: 10.1007/978-1-4939-2648-0_6. Methods Mol Biol. 2015. PMID: 25930695
-
Quantitation of protein phosphorylation in pregnant rat uteri using stable isotope dimethyl labeling coupled with IMAC.Proteomics. 2006 Mar;6(6):1722-34. doi: 10.1002/pmic.200500507. Proteomics. 2006. PMID: 16470654
-
Quantitative analysis of global phosphorylation changes with high-resolution tandem mass spectrometry and stable isotopic labeling.Methods. 2013 Jun 15;61(3):251-9. doi: 10.1016/j.ymeth.2013.04.010. Epub 2013 Apr 21. Methods. 2013. PMID: 23611819 Free PMC article. Review.
-
Stable isotope dimethyl labelling for quantitative proteomics and beyond.Philos Trans A Math Phys Eng Sci. 2016 Oct 28;374(2079):20150364. doi: 10.1098/rsta.2015.0364. Philos Trans A Math Phys Eng Sci. 2016. PMID: 27644970 Free PMC article. Review.
Cited by
-
Quantification of protein isoforms in mesenchymal stem cells by reductive dimethylation of lysines in intact proteins.Proteomics. 2012 Feb;12(3):369-79. doi: 10.1002/pmic.201100308. Epub 2012 Jan 13. Proteomics. 2012. PMID: 22144135 Free PMC article.
-
Physical and functional interactome atlas of human receptor tyrosine kinases.EMBO Rep. 2022 Jun 7;23(6):e54041. doi: 10.15252/embr.202154041. Epub 2022 Apr 5. EMBO Rep. 2022. PMID: 35384245 Free PMC article.
-
Interrogating cAMP-dependent kinase signaling in Jurkat T cells via a protein kinase A targeted immune-precipitation phosphoproteomics approach.Mol Cell Proteomics. 2013 Nov;12(11):3350-9. doi: 10.1074/mcp.O113.028456. Epub 2013 Jul 23. Mol Cell Proteomics. 2013. PMID: 23882029 Free PMC article.
-
Identification of Phosphorylated Cyclin-Dependent Kinase 1 Associated with Colorectal Cancer Survival Using Label-Free Quantitative Analyses.PLoS One. 2016 Jul 6;11(7):e0158844. doi: 10.1371/journal.pone.0158844. eCollection 2016. PLoS One. 2016. PMID: 27383761 Free PMC article.
-
Phosphoproteome dynamics upon changes in plant water status reveal early events associated with rapid growth adjustment in maize leaves.Mol Cell Proteomics. 2012 Oct;11(10):957-72. doi: 10.1074/mcp.M111.015867. Epub 2012 Jul 10. Mol Cell Proteomics. 2012. PMID: 22787273 Free PMC article.
References
-
- Blume-Jensen P., Hunter T. (2001) Oncogenic kinase signalling. Nature 411, 355–365 - PubMed
-
- Blagoev B., Ong S. E., Kratchmarova I., Mann M. (2004) Temporal analysis of phosphotyrosine-dependent signaling networks by quantitative proteomics. Nat. Biotechnol 22, 1139–1145 - PubMed
-
- Steen H., Kuster B., Fernandez M., Pandey A., Mann M. (2002) Tyrosine phosphorylation mapping of the epidermal growth factor receptor signaling pathway. J. Biol. Chem 277, 1031–1039 - PubMed
-
- Thelemann A., Petti F., Griffin G., Iwata K., Hunt T., Settinari T., Fenyo D., Gibson N., Haley J. D. (2005) Phosphotyrosine signaling networks in epidermal growth factor receptor overexpressing squamous carcinoma cells. Mol. Cell. Proteomics 4, 356–376 - PubMed
-
- Zhang Y., Wolf-Yadlin A., Ross P. L., Pappin D. J., Rush J., Lauffenburger D. A., White F. M. (2005) Time-resolved mass spectrometry of tyrosine phosphorylation sites in the epidermal growth factor receptor signaling network reveals dynamic modules. Mol. Cell. Proteomics 4, 1240–1250 - PubMed
Publication types
MeSH terms
Substances
LinkOut - more resources
Full Text Sources
Other Literature Sources
