Comparative Study
. 2009 Nov 15;587(Pt 22):5411-25.
doi: 10.1113/jphysiol.2009.176552. Epub 2009 Sep 21.

Frequency-dependent disynaptic inhibition in the pyramidal network: a ubiquitous pathway in the developing rat neocortex

Affiliations
Comparative Study

Frequency-dependent disynaptic inhibition in the pyramidal network: a ubiquitous pathway in the developing rat neocortex

Thomas K Berger et al. J Physiol. .

Abstract

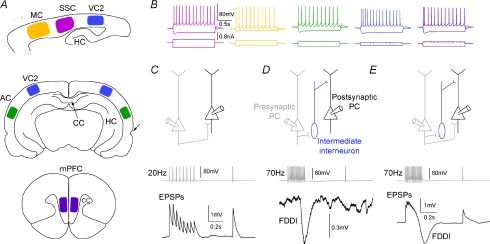
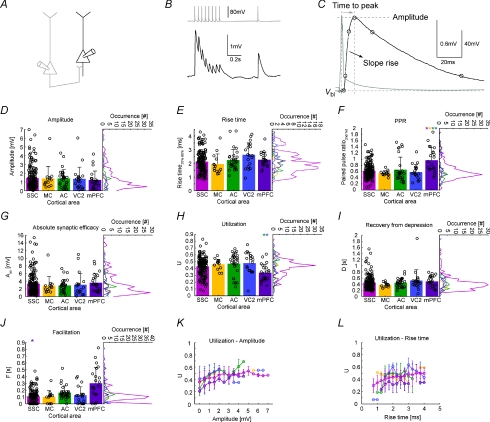
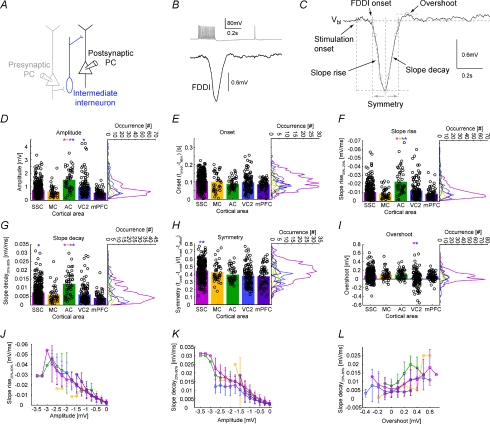
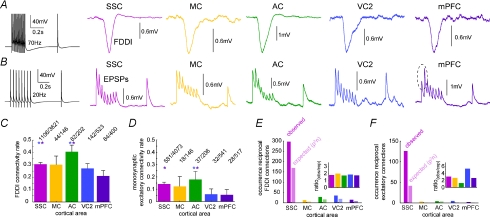
The general structure of the mammalian neocortex is remarkably similar across different cortical areas. Despite certain cytoarchitectural specializations and deviations from the general blueprint, the principal organization of the neocortex is relatively uniform. It is not known, however, to what extent stereotypic synaptic pathways resemble each other between cortical areas, and how far they might reflect possible functional uniformity or specialization. Here, we show that frequency-dependent disynaptic inhibition (FDDI) is a generic circuit motif that is present in all neocortical areas we investigated (primary somatosensory, auditory and motor cortex, secondary visual cortex and medial prefrontal cortex of the developing rat). We did find, however, area-specific differences in occurrence and kinetics of FDDI and the short-term dynamics of monosynaptic connections between pyramidal cells (PCs). Connectivity between PCs, both monosynaptic and via FDDI, is higher in primary cortices. The long-term effectiveness of FDDI is likely to be limited by an activity-dependent attenuation of the PC-interneuron synaptic transmission. Our results suggest that the basic construction of neocortical synaptic pathways follows principles that are independent of modality or hierarchical order within the neocortex.


Figures

Figure 1
Figure 1. Cortical areas and stimulation protocols
A, cortical areas that have been investigated. Top, parasagittal slice with primary motor cortex (yellow, MC), primary somatosensory cortex (pink, SSC), and secondary visual cortex (blue, VC2). Hippocampus abbreviated as HC. Middle, coronal slice with VC2 and primary auditory cortex (green, AC). Intact corpus callosum (CC) and rhinal fissure are indicated by arrows. Bottom, coronal slice with medial prefrontal cortex (purple, mPFC). B, firing pattern and hyperpolarizing voltage response to de- and hyperpolarizing step currents. All cells were continuous or burst-regular spiking. C, two pyramidal cells (PCs), directly interconnected. The presynaptic cell was stimulated with an 8 spike–20 Hz train plus recovery test pulse 0.5 s later in order to determine EPSP kinetics and short-term dynamics. D, two PCs interconnected via a single (or multiple) interneuron(s). High frequency stimulation in the presynaptic PC (15 spikes, 70 Hz) elicits suprathreshold activity in a nearby interneuron, which in turn gives rise to FDDI in a neighbouring PC. E, two PCs connected with both monosynaptic EPSPs and FDDI.
Figure 5
Figure 5. Area-specific kinetics of EPSPs and short term dynamics of EPSP trains
A, a presynaptic PC (grey) connecting to a postsynaptic PC (black). B, stimulation of the presynaptic PC leading to EPSPs in the postsynaptic PC. C, parameters extracted from the monosynaptic excitatory response. D and E, amplitude and 20–80% rise time of the first EPSP in the train. F, paired pulse ratio of 2nd over 1st EPSP amplitude. GJ, parameters extracted from a fit to a model of synaptic dynamics: bar graphs show the mean, black circles individual data points (scattered for better illustration). Vertical histograms contain 31 equally spaced bins. See Methods for a detailed description of the parameter extraction. Error bars denote standard deviation. Only highly significant differences (P < 0.01), colour coded (in one direction for a pair) are marked with an asterisk (Kruskal–Wallis test followed by Dunn's method for multiple comparisons, see Table 2). KL, utilization as a function of amplitude and rise time. Abscissa was divided into 15 (K) or 17 (L) equally spaced bins. Colour coding for the different areas as in the histograms.
Figure 4
Figure 4. Area-specific kinetics of FDDI
A, a presynaptic PC (grey), connecting to an interneuron (blue), in turn innervating a postsynaptic PC (black). B, stimulation of the presynaptic PC leading to FDDI in the postsynaptic PC. C, parameters extracted from the disynaptic inhibitory response. DI, amplitude, onset time (tonsettstim), slopes of the rising and decaying phases, symmetry (tpeaktonset)/(tonsettoffset) and overshoot of the FDDI response. Colour code corresponds to areas depicted in Fig. 1. Bar graphs show the mean, black circles individual data points (scattered for better illustration). Vertical histograms contain 31 equally spaced bins. See Methods for a detailed description of the parameter extraction. Error bars denote standard deviation. Only highly significant differences (P < 0.01), colour coded (in one direction for a pair) are marked with an asterisk (Kruskal–Wallis test followed by Dunn's method for multiple comparisons, see Table 1). J, slope rise time as a function of FDDI amplitude. K, slope decay time as a function of FDDI amplitude. L, slope decay time as a function of overshoot. For JL, abscissa was divided into 15 (J and K), or 12 (L) equally spaced bins. Colour coding for the different areas as in the histograms.
Figure 2
Figure 2. Connectivity ratios of FDDI and EPSPs in different cortical areas
A, high frequency stimulation (70 Hz) of a PC and examples of responses in a postsynaptic PC in SSC, MC, AC, VC2 and mPFC. B, 20 Hz stimulation of a PC and examples of responses in a postsynaptic PC in the same cortial areas as in A. C, FDDI connectivity rate between PCs in the investigated cortical areas. Highly significant differences were found between some areas (PSSC−AC= 0.0027, PSSC−mPFC= 7.24 × 10⁻⁵, PAC−VC2= 4.44 × 10⁻⁴, PAC−mPFC= 3.78 × 10⁻⁷, two-sided χ2 test). D, monosynaptic excitatory connectivity between PCs in the investigated cortical areas. Significant differences were found between primary (SSC, MC, AC) and non-primary (VC2, mPFC) cortices (PSSC−VC2= 7.6 × 10⁻⁸, PSSC−mPFC= 2.3 × 10⁻⁸, PMC−VC2= 0.0081, PMC−mPFC= 0.0037, PAC−VC2= 3.74 × 10⁻⁷, PAC−mPFC= 1.02 × 10⁻⁷, two-sided χ2 test). E, occurrence of reciprocal FDDI connections between PCs in the investigated cortical areas. Expectancy was calculated as P2n. Inset shows the ratio between observed and expected occurrences. F, occurrence of reciprocal monosynaptic excitatory connections between PCs in the investigated cortical areas. Colour code as in Fig. 1. Error bars in C and D denote s.e.m.
Figure 3
Figure 3. Seven-cell cluster example in AC
A, relative somatic positions of seven simultaneously patched cells and their connectivity in the AC. Cell 5 received monosynaptic excitatory input from cells 3, 6 and 7, and cell 2 received input from cell 6. Cells 1–6 were all interconnected with FDDI. B, matrix of the membrane potentials of all seven cells in response to high frequency stimulation. Postsynaptic voltage response to a presynaptic stimulation (on the diagonal) is shown in the corresponding row. Electrodes (cells) next to the stimulated electrode (on the secondary diagonals in the matrix) show stimulation artifacts in the voltage trace.
Figure 6
Figure 6. Distance-dependent drop of connectivity
A, occurrence of FDDI connections as a function of the intersomatic distance of two PCs. Light pink shows the number of unconnected pairs, dark pink the number of connected pairs. Inset shows the ratio of connected over unconnected pairs. Binning was in 25 μm steps. B, occurrence of monosynaptic connections as a function of the intersomatic distance of two PCs. Labelling and binning as in A. C, normalized connectivity ratio as a function of the intersomatic distance of two PCs (black, FDDI; grey, EPSPs). Dashed lines are Gaussian fits (FDDI, λ= 290 μm; EPSPs, λ= 265 μm). Binning as in A. D, FDDI amplitude as a function of intersomatic distance. E, EPSP amplitudes as a function of intersomatic distance. F, FDDI and EPSP amplitudes as a function of intersomatic distance, binned in 25 mm steps. Dashed lines are exponential fits (FDDI, black, λ= 97 μm; EPSPs, grey, λ= 126 μm). Error bars denote s.e.m. (A and B) or standard deviation (F).
Figure 7
Figure 7. Stability of FDDI after repetitive stimulation
A, a PC (grey) connecting via an interneuron (blue) to a postsynaptic PC (black). B, high frequency stimulation of the presynaptic PC (grey) with the individual responses of the postsynaptic PC (black). The first 30 repetitions were applied with only 1 s waiting time between each stimulus application, the last 30 repetitions were done with 30 s waiting time. C, FDDI amplitude as a function of time and inter-stimulation interval (waiting time). Circles denote the amplitude, lines at the bottom of the graph the time of stimulation. D, FDDI amplitude as a function of time, with a binning of 10 repetitions. Grey background illustrates the epochs of ‘fast’ stimulation with small inter-stimulation intervals (1 s waiting time). Error bars denote s.e.m.
Figure 8
Figure 8. The PC–interneuron synapse limits FDDI stability
A, FDDI amplitude as a function of time and inter-stimulation interval in control conditions (black) and in the presence of the endocannabinoid receptor antagonist AM251 (10 μm, red). B, FDDI amplitude as a function of time and inter-stimulation interval, with ‘fast’ stimulation (small waiting time) of 20 instead of 70 Hz. Stimulation of 20 Hz does not usually trigger suprathreshold activity in the interneuron, therefore allowing the isolation of synaptic- from spike-evoked effects. Error bars denote s.e.m.

Comment in

Similar articles

Cited by

References

    1. Abrahamsson T, Gustafsson B, Hanse E. Synaptic fatigue at the naive perforant path–dentate granule cell synapse in the rat. J Physiol. 2005;569:737–750. - PMC - PubMed
    1. Arsiero M, Lüscher H-R, Lundstrom BN, Giugliano M. The impact of input fluctuations on the frequency–current relationships of layer 5 pyramidal neurons in the rat medial prefrontal cortex. J Neurosci. 2007;27:3274–3284. - PMC - PubMed
    1. Bacci A, Huguenard J, Prince D. Long-lasting self-inhibition of neocortical interneurons mediated by endocannabinoids. Nature. 2004;431:312–316. - PubMed
    1. Berger T, Larkum ME, Lüscher HR. High Ih channel density in the distal apical dendrite of layer V pyramidal cells increases bidirectional attenuation of EPSPs. J Neurophysiol. 2001;85:855–868. - PubMed
    1. Braitenberg V, Schüz A. Cortex: Statistics and Geometry of Neuronal Connectivity. 2nd edn. Berlin, Heidelberg, New York: Springer; 1998.

Publication types

LinkOut - more resources