. 2009 Dec;26(12):2841-8.
doi: 10.1093/molbev/msp194. Epub 2009 Sep 21.

Novel internal regions of fluorescent proteins undergo divergent evolutionary patterns

Affiliations

Novel internal regions of fluorescent proteins undergo divergent evolutionary patterns

David F Gruber et al. Mol Biol Evol. 2009 Dec.

Abstract

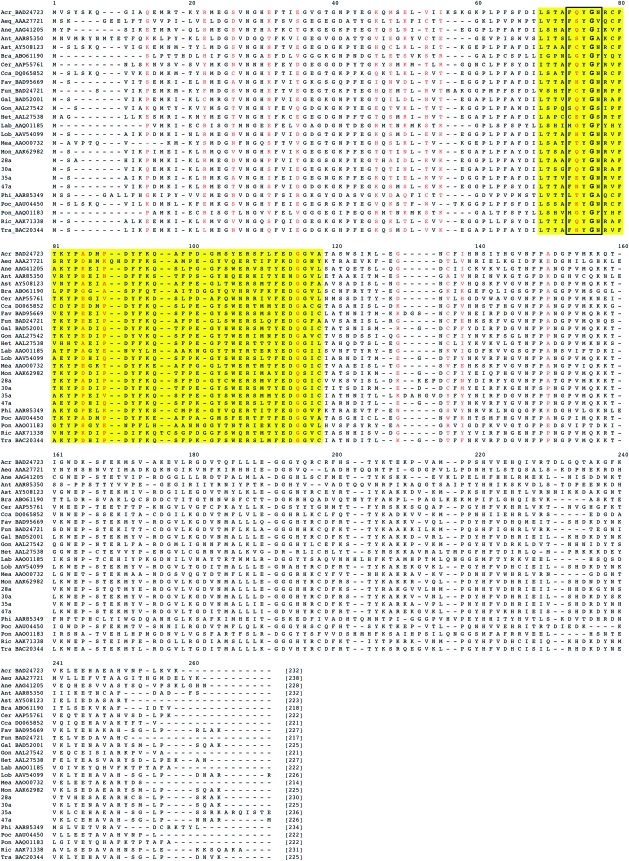
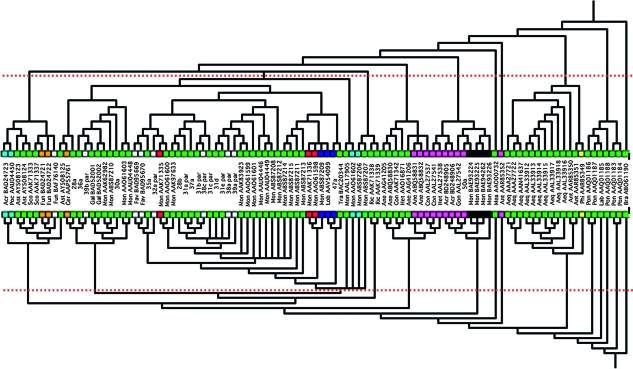
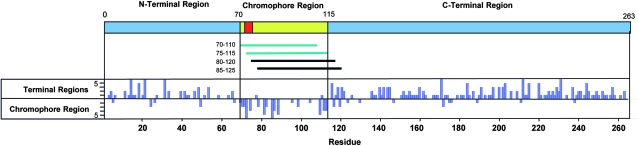
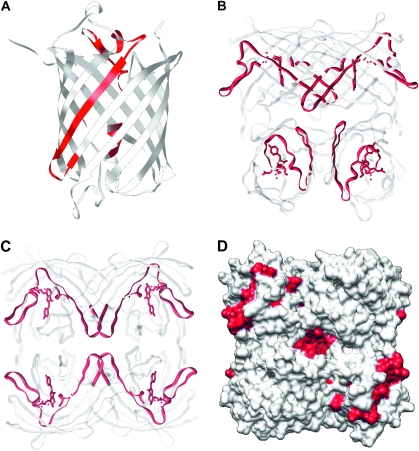
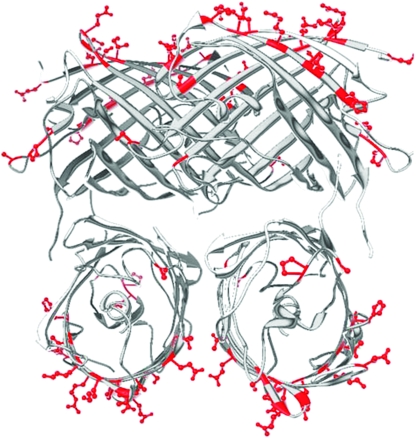
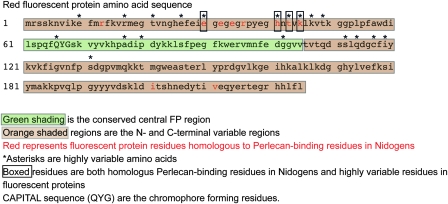
Over the past decade, fluorescent proteins (FPs) have become ubiquitous tools in biological research. Yet, little is known about the natural function or evolution of this superfamily of proteins that originate from marine organisms. Using molecular phylogenetic analyses of 102 naturally occurring cyan fluorescent proteins, green fluorescent proteins, red fluorescent proteins, as well as the nonfluorescent (purple-blue) protein sequences (including new FPs from Lizard Island, Australia) derived from organisms with known geographic origin, we show that FPs consist of two distinct and novel regions that have evolved under opposite and sharply divergent evolutionary pressures. A central region is highly conserved, and although it contains the residues that form the chromophore, its evolution does not track with fluorescent color and evolves independently from the rest of the protein. By contrast, the regions enclosing this central region are under strong positive selection pressure to vary its sequence and yet segregate well with fluorescence color emission. We did not find a significant correlation between geographic location of the organism from which the FP was isolated and molecular evolution of the protein. These results define for the first time two distinct regions based on evolution for this highly compact protein. The findings have implications for more sophisticated bioengineering of this molecule as well as studies directed toward understanding the natural function of FPs.


Figures

F<sc>IG</sc>. 1.—
FIG. 1.—
Alignment of a subset of FPs, spanning all representative genus. Phylogenic analysis was performed on the 104 sequences listed in the supplementary file 1 (Supplementary Material online).
F<sc>IG</sc>. 2.—
FIG. 2.—
Trees generated for the chromophore region (bottom) and for the nonchromophore terminal regions (top). The trees were generated using parsimony and robustness of nodes inferred with bootstrap analyses. The dotted lines indicate the general region of the trees where robustness falls below 70%. Bayes analyses were also performed (see supplementary file 3, Supplementary Material online), and the dotted line also indicates the general region where posterior probabilities fall below 0.90. Colors at the tips of the tree indicate the color of the GFP—green = green; light blue = cyan; orange = orange; black = mutant; yellow = yellow; pink = chromatic; red = red; dark blue = Kaede; and white = unknown.
F<sc>IG</sc>. 3.—
FIG. 3.—
Regions of divergent molecular evolution in FPs. Map of a typical FP is shown with terminal regions in blue, the internal chromophore region in yellow, and the 3-residue chromophore in red. Below the map are lines representing 40-residue sliding window segments (with region designated) that were examined for congruence with the terminal regions. Blue lines indicate sliding windows that were shown to be incongruent with the terminal regions with statistical significance. The histogram below the map plots the difference in number of steps it takes to construct a phylogenetic tree using the N/C-terminal regions versus the middle region, for each residue in the protein. Residue position is indicated at the bottom.
F<sc>IG</sc>. 4.—
FIG. 4.—
The conserved central domain (red) and flanking variable domains (white/grey) imposed on a ribbon diagram of monomer (A) and tetramer (B and C) of the red fluorescent protein crystal structure. (B) A standard view of the tetramer. (C) A slight rotation to highlight the proximity of the beta strands of the conserved region. (D) Electron density map created in Chimera (Pettersen et al. 2004) depicting residues (in red) corresponding to the middle conserved region mapped to the crystal structure of discosoma red flourescent protein.
F<sc>IG</sc>. 5.—
FIG. 5.—
Ball and stick diagram depicting residues (in red) undergoing rapid molecular change mapped to the crystal structure of discosoma red fluorescent protein. These residues were determined by analyses of FPs derived from Montastrea cavernosa from different geographic regions (supplementary data, Supplementary Material online).
F<sc>IG</sc>. 6.—
FIG. 6.—
FP residues homologous to perlecan-binding residues in nidogen proteins.

References

    1. Alieva NO, Konzen KA, Field SF, Meleshkevitch EA, Hunt ME, Beltran-Ramirez V, Miller DJ, Wiedenmann J, Salih A, Matz MV. Diversity and evolution of coral fluorescent proteins. PLoS ONE. 2008;3:e2680. - PMC - PubMed
    1. Ataka K, Pieribone VA. A genetically targetable fluorescent probe of channel gating with rapid kinetics. Biophys J. 2002;82:509–516. - PMC - PubMed
    1. Bou-Abdallah F, Chasteen ND, Lesser MP. Quenching of superoxide radicals by green fluorescent protein. Biochim Biophys Acta. 2006;1760:1690–1695. - PMC - PubMed
    1. Chalfie M, Tu Y, Euskirchen G, Ward WW, Prasher DC. Green fluorescent protein as a marker for gene expression. Science. 1994;263:802–805. - PubMed
    1. Field SF, Bulina MY, Kelmanson IV, Bielawski JP, Matz MV. Adaptive evolution of multicolored fluorescent proteins in reef-building corals. J Mol Evol. 2006;62:U3, 32–U315. - PubMed

Publication types