. 2009 Oct;65(Pt 10):1107-17.
doi: 10.1107/S0907444909030613. Epub 2009 Sep 16.

Modeling discrete heterogeneity in X-ray diffraction data by fitting multi-conformers

Affiliations

Modeling discrete heterogeneity in X-ray diffraction data by fitting multi-conformers

Henry van den Bedem et al. Acta Crystallogr D Biol Crystallogr. 2009 Oct.

Abstract

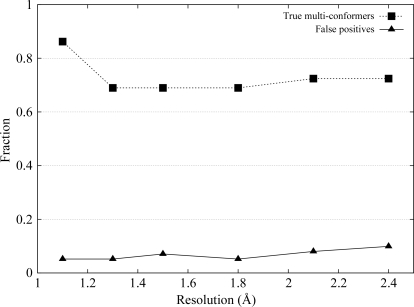
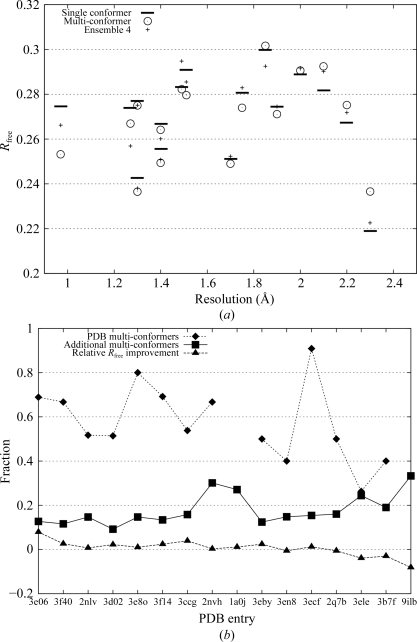
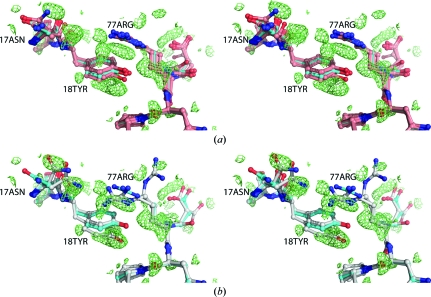
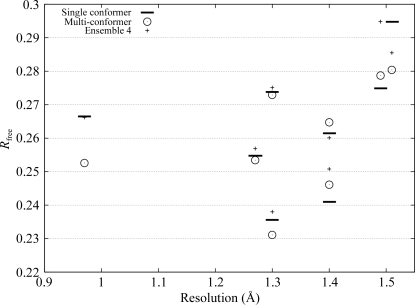
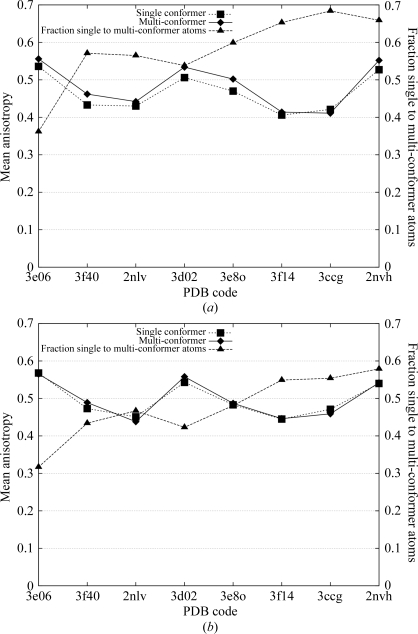
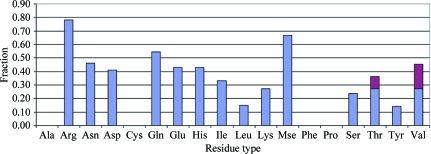
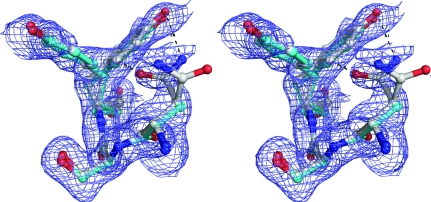
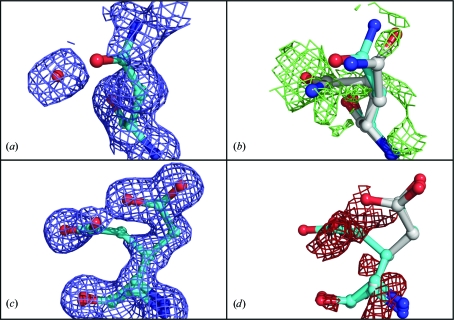
The native state of a protein is regarded to be an ensemble of conformers, which allows association with binding partners. While some of this structural heterogeneity is retained upon crystallization, reliably extracting heterogeneous features from diffraction data has remained a challenge. In this study, a new algorithm for the automatic modelling of discrete heterogeneity is presented. At high resolution, the authors' single multi-conformer model, with correlated structural features to represent heterogeneity, shows improved agreement with the diffraction data compared with a single-conformer model. The model appears to be representative of the set of structures present in the crystal. In contrast, below 2 A resolution representing ambiguous electron density by correlated multi-conformers in a single model does not yield better agreement with the experimental data. Consistent with previous studies, this suggests that variability in multi-conformer models at lower resolution levels reflects uncertainty more than coordinated motion.


Figures

Figure 1
Figure 1
Validation of the algorithm. The fraction of the 29 multi-conformer side chains in the reference structure correctly identified and modeled by our algorithm (squares) and false positives (triangles) at resolution levels ranging from 1.1 to 2.4 Å are shown.
Figure 2
Figure 2
Summary of the performance of the algorithm on experimental data. (a) shows R free values of the reference models (horizontal bars), our multi-conformer models (circles) and an ensemble of four independent models (crosses) as a function of resolution. (b) is similar to Fig. 1 ▶, but with experimental data. The PDB codes of the 16 test structures are listed in order of decreasing resolution along the horizontal axis. The fraction of multi-conformer side chains in each of the 16 reference PDB structures correctly modeled by our algorithm is represented by diamonds. No alternate conformers were present in the PDB structures of 1a0j and 9ilb. Additional conformers are represented by squares. The triangles represent the relative improvement in R free. A positive value indicates a drop in R free.
Figure 3
Figure 3
Stereo representation of a heterogeneous area around residues Tyr18 and Arg77 in 2nlv. (a) The single-conformer reference model is shown in cyan. Positive density of the mF oDF c difference map corresponding to the single model, shown in lime, is contoured at 1.75σ. (b) Our multi-conformer model, shown in grey, neatly models alternate conformers of Asn17, Tyr18 and Arg77 in the positive density, albeit at the cost of a small misfit in the B conformer of Arg77. The algorithm did not find sufficient evidence for the Asn17 side-chain conformation of the reference model. Examination of the difference map reveals a substantial negative peak in this area (not shown).
Figure 4
Figure 4
Anisotropic R free values of the eight highest resolution multi-conformer models (circles) and their single-conformer reference models (horizontal bars). Crosses represent the R free values obtained from isotropic ensemble refinement of independent models, which are identical to those in Fig. 2 ▶.
Figure 5
Figure 5
Mean main-chain (a) and side-chain (b) anisotropy for eight selected high-resolution structural models. Listed along the horizontal axis are the PDB codes of the eight test structures in order of decreasing resolution. The single-conformer reference models are represented by squares and our multi-conformer models by diamonds. Triangles depict the ratio of the number of single-conformer atoms to the number of multi-conformer atoms.
Figure 6
Figure 6
Agreement with PDB multi-conformers. The fraction of all 228 multi-conformer residues among the 16 structural models for which the algorithm disagreed with one or more of the conformations in the PDB entry by residue type. The denominator is given by the total number of residues of a given type with two or more alternate conformations. The numerator is the number of residues of that type for which the algorithm failed to model the full set of alternate conformations to within 1 Å r.m.s.d. For Ala, Cys, Phe and Pro side chains no disagreement greater than 1 Å was found. The geometry of Thr and Val side chains allows near-equivalent explanation of electron density with distinct combinations of rotamers; the magenta top of the bars for these side chains indicates the fraction for which our algorithm models the density with a different combination than that found in the PDB entry. Gly is excluded and alternate conformations of Trp were not observed among the 16 models.
Figure 7
Figure 7
Side-chain and main-chain heterogeneity. Stereo representation of residues Asn80, Ser81 and Tyr82 of 3ccg, with the PDB entry (cyan) and our model (grey) shown in 2mF oDF c density contoured at 0.5σ. The two models overlap near-perfectly for this fragment.
Figure 8
Figure 8
Ambiguous density around acidic side chains and their amide counterparts. (a) Residue Gln14 as modeled in PDB entry 2nvh, with a water molecule modeled in nearby 2mF oDF c density. (b) Our model (grey) shown in mF oDF c difference density calculated from the PDB entry with the water molecule removed. The difference density, contoured at 1.1σ, extends from the carbonyl group back to the Cγ atom of the added conformer. (c) Residue Glu13 as modeled in PDB entry 3d02, with two conformers at 0.5/0.5 occupancy in 2mF oDF c density contoured at 0.75σ. (d) Our model (grey) in mF oDF c difference density contoured at −1.5σ.

References

    1. Afonine, P. V., Grosse-Kunstleve, R. W. & Adams, P. D. (2005a). Acta Cryst. D61, 850–855. - PMC - PubMed
    1. Afonine, P. V., Grosse-Kunstleve, R. W. & Adams, P. D. (2005b). CCP4 Newsl.42, contribution 8.
    1. Bedem, H. van den, Lotan, I., Latombe, J.-C. & Deacon, A. M. (2005). Acta Cryst. D61, 2–13. - PubMed
    1. Berman, H. M., Henrick, K., Nakamura, H. & Arnold, E. (2006). Nature Struct. Mol. Biol.13, 185.
    1. Berman, H. M., Westbrook, J., Feng, Z., Gilliland, G., Bhat, T. N., Weissig, H., Shindyalov, I. N. & Bourne, P. E. (2000). Nucleic Acids Res.28, 235–242. - PMC - PubMed

Publication types