. 2009 Oct;119(10):2990-9.
doi: 10.1172/JCI39780. Epub 2009 Sep 21.

B cells produce pathogenic antibodies and impair recovery after spinal cord injury in mice

Affiliations

B cells produce pathogenic antibodies and impair recovery after spinal cord injury in mice

Daniel P Ankeny et al. J Clin Invest. 2009 Oct.

Abstract

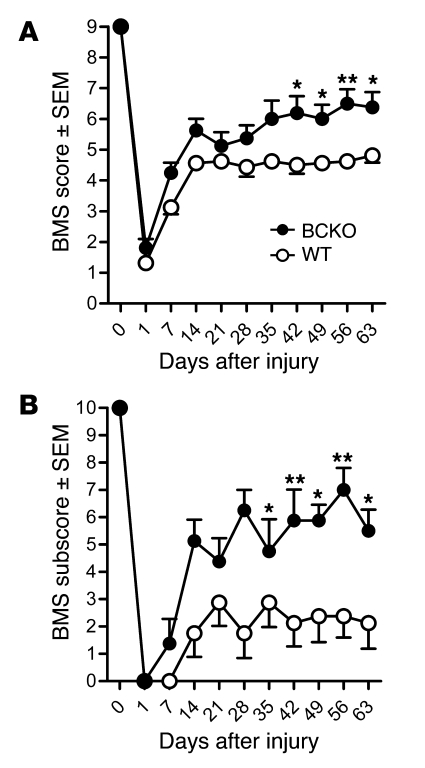
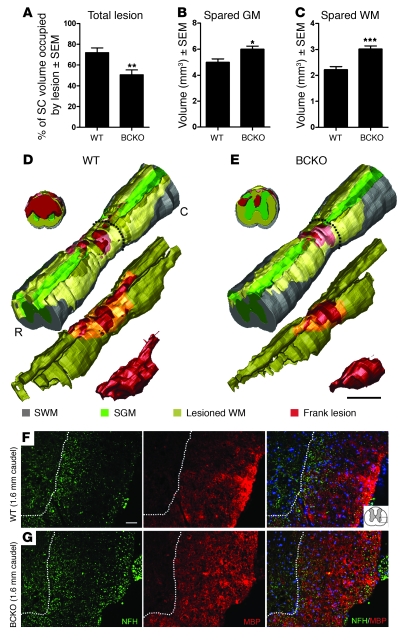
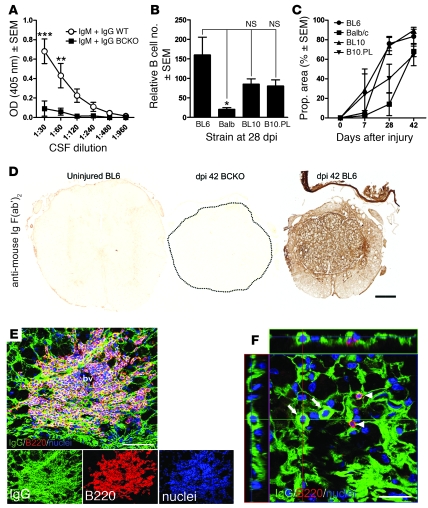
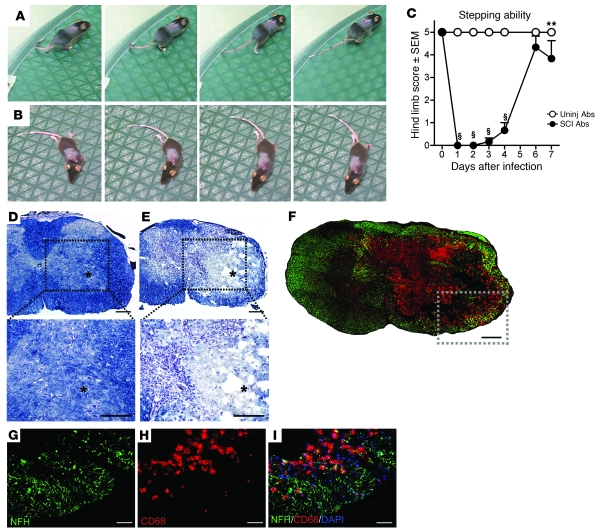
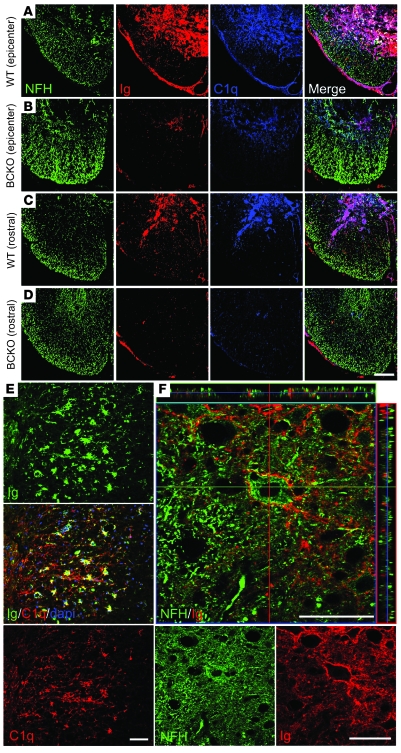
Traumatic injury to the mammalian spinal cord activates B cells, which culminates in the synthesis of autoantibodies. The functional significance of this immune response is unclear. Here, we show that locomotor recovery was improved and lesion pathology was reduced after spinal cord injury (SCI) in mice lacking B cells. After SCI, antibody-secreting B cells and Igs were present in the cerebrospinal fluid and/or injured spinal cord of WT mice but not mice lacking B cells. In mice with normal B cell function, large deposits of antibody and complement component 1q (C1q) accumulated at sites of axon pathology and demyelination. Antibodies produced after SCI caused pathology, in part by activating intraspinal complement and cells bearing Fc receptors. These data indicate that B cells, through the production of antibodies, affect pathology in SCI. One or more components of this pathologic immune response could be considered as novel therapeutic targets for minimizing tissue injury and/or promoting repair after SCI.


Figures

Figure 1
Figure 1. Recovery from SCI is improved in mice that are BCKO and incapable of antibody production.
Locomotor function was analyzed using BMS (A) and subscore (B) analyses. The main BMS score reveals general quadrupedal locomotor ability, while the subscore reveals differences in fine locomotor control (e.g., stepping frequencies, percentage forelimb–hind limb coordination, ability to execute stepping without medial or lateral paw rotation, relative trunk stability and tail position). n = 16–17/group from 2 replicate studies giving equivalent results. *P < 0.05, **P < 0.01, versus WT; 2-way ANOVA with repeated measures, Bonferroni post-test.
Figure 2
Figure 2. Significant neuroprotection is evident in the injured spinal cord of BCKO mice at 63 dpi.
The total lesion volume (A) is reduced in BCKO mice and is accompanied by marked sparing of spinal cord (SC) gray matter (GM) (B), and white matter (WM) (C). Volumes were estimated using Cavalieri’s method. (D and E) 3D reconstructions of spinal cords taken from animals with total lesion volume that is closest to the average for each group. Gray indicates spared white matter (SWM; regions containing myelin and axon profiles that are morphologically normal); green indicates spared gray matter (SGM); red indicates frank lesion (complete loss of normal cytoarchitecture); and yellow indicates lesioned white matter (regions where axons and myelin are absent). Coronal slabs are sampled at 0.8-mm caudal to the injury epicenter and are marked by dashes in the complete 3D reconstructions. C, caudal; R, rostral. Immunofluorescent double labeling of spared white matter 1.6-mm caudal to the injury epicenter from a WT (F) and BCKO mouse (G) reveals increased sparing of axons (green, anti-NFH) and myelin (red, anti-MBP) in BCKO mice. Dotted line delineates gray matter–white matter interface. Blue (DAPI) staining in merged image reveals cell nuclei. Cartoon in top right panel depicts imaged region. Scale bar: 0.5 mm (D and E); 40 μm (F and G). *P < 0.05, **P < 0.01, ***P < 0.001 versus WT; 2-tailed t tests. All data was collected at 63 dpi.
Figure 3
Figure 3. Antibodies, B cells, and plasma cells accumulate in CSF and injured spinal cord.
(A) In contrast to WT mice, BCKO mice fail to produce intrathecal antibodies (ELISA analysis of CSF from n = 8 WT and BCKO mice). (B and C) Quantitation of intraspinal B cell accumulation at 28 dpi (B) and the proportional (prop.) area of IgG staining as a function of time after SCI (C) at the injury site in BL/6 (WT), BALB/c, C57BL/10 (BL10), and B10.PL mice. The intraspinal accumulation of B cells and antibodies is not strain specific, only the magnitude varies; n = 4–8 mice/strain; each bar in B represents the average total number of B220+ lymphocyte profiles in 3 equally spaced sections (1/20th series) spanning 600 μm and centered at the epicenter. (D) Representative sections from uninjured BL/6, SCI BCKO (spinal cord circumscribed by dotted line), and WT mice (42 dpi) reveal the distribution of endogenous antibodies and the specificity of IgG labeling quantified in C, i.e., no labeling exists in spinal cord of uninjured or BCKO mice. (E) Flattened confocal z-stack image reveals accumulation of endogenous antibodies (green, Ig) and Ig+ B cells in the injured spinal cord (42 dpi, individual color channels shown below). bv, blood vessel. (F) Flattened z-stack image with x,y,z-projections showing B220 plasma cells with IgG+ cytoplasm (arrows) nearby but distinct from IgG+B220+ B cells (arrowheads). Scale bars: 200 μm (D); 50 μm (E, top panel); 100 μm (E, bottom panels); 20 μm (F). ***P < 0.001, **P < 0.01 2-way ANOVA with Bonferroni post-test: *P < 0.05, 1-way ANOVA with Tukey’s post-test.
Figure 4
Figure 4. Unilateral intraspinal microinjection of antibodies purified from SCI mice causes hind limb paralysis and neuropathology.
(A and B) A sequence of still video images 1 day after injecting naive (uninjured) mice with control (uninjured) (A) or SCI antibodies (B). One complete step cycle is depicted in both cases. (C) Summary of hind limb function ipsilateral to the site of injection. Scoring is based on the BMS scale (0–5): 0, complete paralysis; 5, plantar stepping during more than 50% of step cycles. Scores above 5 were not considered, as our analyses were restricted to the limb on the injected side only. uninj, uninjured mice. **P < 0.01 versus uninjured; §P < 0.001 versus uninjured, 2-way ANOVA with Bonferroni’s post-hoc test. (D and E) Low- and high-power images from a mouse injected with control (D) or SCI antibodies (E), respectively. Note that intraspinal pathology is only evident in mice receiving SCI antibodies; the asterisk indicates the injection target. (F) Phagocytic microglia/ macrophages (red, anti-CD68) colocalize with axon/neuron pathology (green, anti–200-kDa NFH) at the site of injection in mice receiving SCI antibodies. (GI) High-power images of boxed region in F. Scale bars: 0.2 mm (DF); 50 μm (GI).
Figure 5
Figure 5. SCI antibody-mediated neuropathology is complement and Fc-receptor dependent.
(A) Summary of function in hind limb ipsilateral to the site where purified control or SCI antibodies were injected (see Figure 4). Control or SCI antibodies were injected into WT, C3–/–, or FcRg–/– mice (FcR–/–). (B and C) As in Figure 4, SCI antibodies cause marked pathology over approximately 3.6 mm of spinal cord. This is significantly reduced in mice deficient in complement or FcRs. **P < 0.01, ***P < 0.001 ANOVA with Tukey’s post-hoc test. (D) 3D reconstructions show the pathology caused by injections of SCI Abs into WT, C3–/–, or FcRg–/– mice. Gray indicates intact white matter; green indicates intact gray matter; and red indicates lesioned tissue. A spinal cord closest to the mean lesion volume is shown for each group.
Figure 6
Figure 6. IgG and complement C1q colocalize in regions of pathology in spinal cord of WT mice.
(A and C) Confocal microscopy reveals a relationship among axons (green, anti–200-kDa NFH), Igs (red, anti-mouse Ig), and complement C1q (blue, anti-C1q) in the ventrolateral funiculus at a site and rostral (1.6 mm) to a site of SCI in WT mice. (B and D) In BCKO mice, sparse Ig and C1q labeling can be seen among markedly preserved axon tracts and gray matter. (E) Colocalization of IgG (green) and C1q on cells with glial morphology in the lateral funiculus approximately 400-μm caudal to the epicenter. (F) x/y/z-projections of a flattened z-stack image from a section adjacent to site of injury, showing IgG and NFH colocalization in the ventral horn, on a cell with motor neuron morphology (center): single channel images are depicted below. Scale bars: 100 μm (AD); 50 μm (E and F).

Comment in

Similar articles

Cited by

References

    1. Kigerl K.A., McGaughy V.M., Popovich P.G. Comparative analysis of lesion development and intraspinal inflammation in four strains of mice following spinal contusion injury. J. Comp. Neurol. 2006;494:578–594. doi: 10.1002/cne.20827. - DOI - PMC - PubMed
    1. Popovich P.G., et al. Depletion of hematogenous macrophages promotes partial hindlimb recovery and neuroanatomical repair after experimental spinal cord injury. Exp. Neurol. 1999;158:351–365. doi: 10.1006/exnr.1999.7118. - DOI - PubMed
    1. Sroga J.M., Jones T.B., Kigerl K.A., McGaughy V.M., Popovich P.G. Rats and mice exhibit distinct inflammatory reactions after spinal cord injury. J. Comp. Neurol. 2003;462:223–240. doi: 10.1002/cne.10736. - DOI - PubMed
    1. Blight A.R. Delayed demyelination and macrophage invasion: a candidate for secondary cell damage in spinal cord injury. Cent. Nerv. Syst. Trauma. 1985;2:299–315. - PubMed
    1. Blight A.R. Effects of silica on the outcome from experimental spinal cord injury: implication of macrophages in secondary tissue damage. Neuroscience. 1994;60:263–273. doi: 10.1016/0306-4522(94)90220-8. - DOI - PubMed

Publication types

MeSH terms