. 2010 Jan;20(1):72-88.
doi: 10.1038/cr.2009.112. Epub 2009 Sep 22.

Fas stimulation of T lymphocytes promotes rapid intercellular exchange of death signals via membrane nanotubes

Affiliations

Fas stimulation of T lymphocytes promotes rapid intercellular exchange of death signals via membrane nanotubes

Peter D Arkwright et al. Cell Res. 2010 Jan.

Abstract

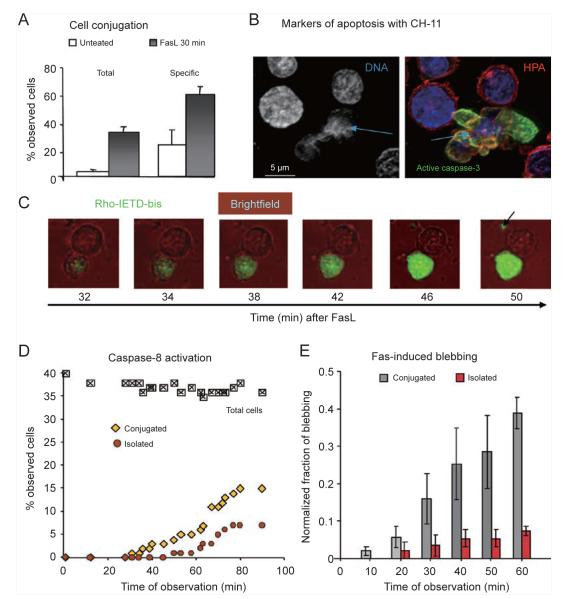
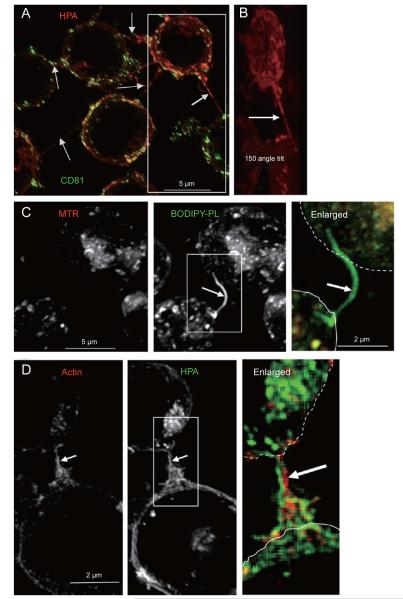
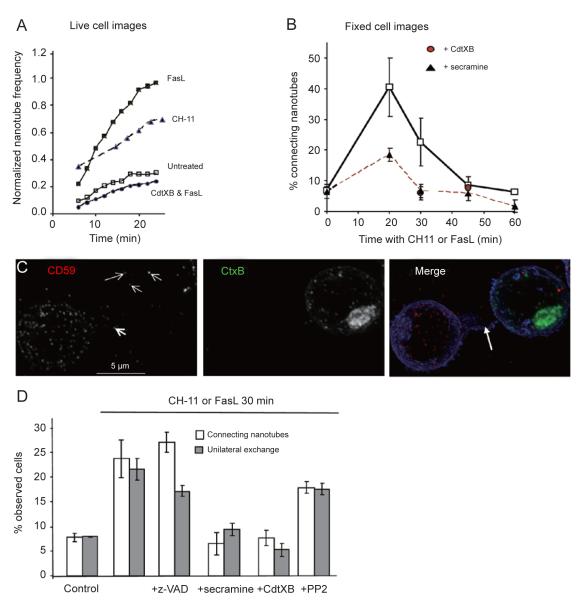
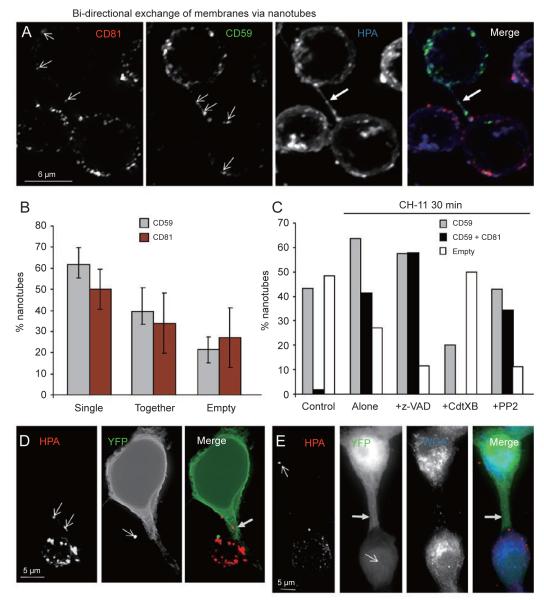
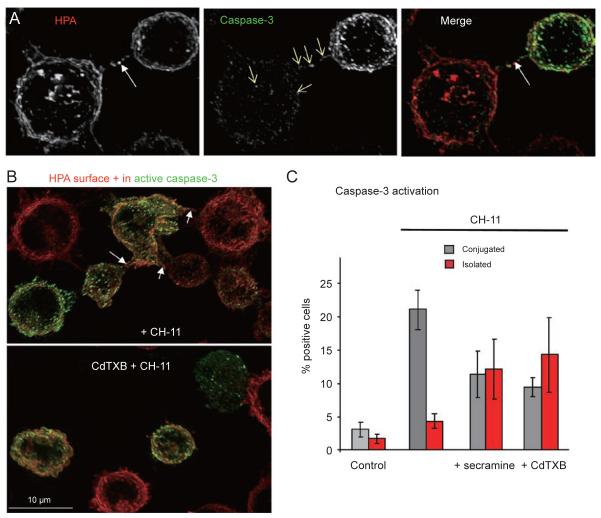
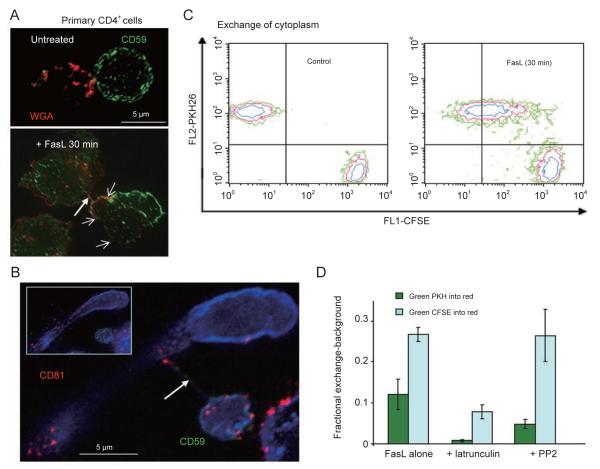
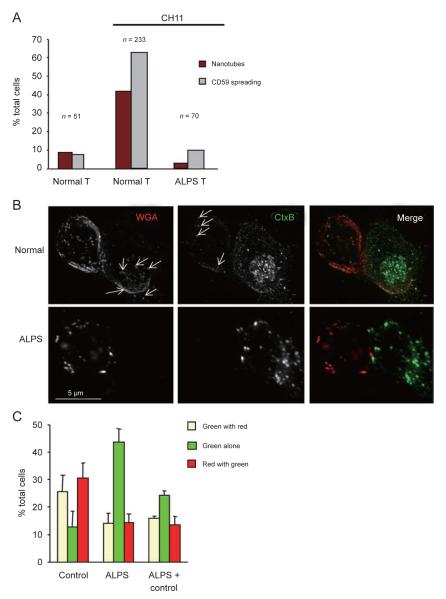
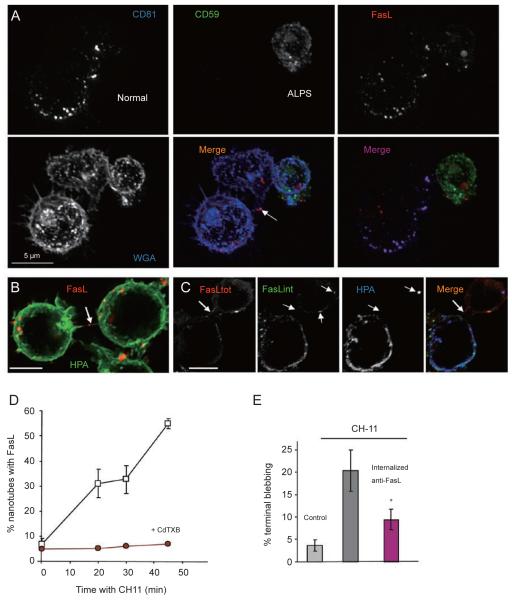
The Fas/CD95 surface receptor mediates rapid death of various cell types, including autoreactive T cells with the potential for triggering autoimmunity. Here, we present novel aspects of Fas signalling that define a 'social' dimension to receptor-induced apoptosis. Fas stimulation rapidly induces extensive membrane nanotube formation between neighbouring T cells. This is critically dependent on Rho GTPases but not on caspase activation. Bidirectional transfer of membrane and cytosolic elements including active caspases can be observed to occur via these nanotubes. Nanotube formation and intercellular exchanges of death signals are defective in T lymphocytes from patients with autoimmune lymphoproliferative syndrome harbouring mutations in the Fas receptor. We conclude that nanotube-mediated exchanges constitute a novel form of intercellular communication that augments the propagation of death signalling between neighbouring T cells.


Figures

Figure 1
Figure 1
Fas stimulation increases cell conjugation leading to asymmetric death. (A) Fas stimulation increases cell conjugation. The histograms on the left represent the average percentage of couplings in > 2 000 Jurkat T cells from n = 5 separate experiments with cell density varying from 2 to 5 × 10⁶ per ml. The histograms on the right represent the average frequency of ‘specific polarization’, which was evaluated by four independent scorers in images of cells labelled with markers of the Golgi region like CtxB [11, 12] (Supplementary information, Figure S1A). Blind scoring counted conjugates in which one cell had its Golgi region clearly at the opposite side of the junction with the other cell, a configuration that increased after FasL treatment from the expected frequency of around 30% in untreated cells. Statistical differences between FasL-treated and untreated cells were highly significant (P < 0.02, Mann-Whitney). (B) Representative image combining the three markers for apoptosis used here to determine the level of cell death: nuclear fragmentation with the blue Hoechst dye, activation of caspase-3 with a specific antibody (with a green secondary) and membrane blebbing with red HPA. The blebbing cell showing nuclear fragmentation and diffuse caspase activation is conjugated with a cell showing no evident sign of incipient apoptosis. (C) The sequence of frames shows a cell conjugate displaying asymmetric fluorescence of Rhodamine110-IETD-bisamide (10 μM, a substrate for caspase-8 [13, 37]) in live cell images of Jurkat cells treated with FasL. Bright field images are coloured red for contrast. The arrow indicates a surface membrane cluster (microparticle?) apparently lying at the extreme periphery of the top cell that showed delayed caspase activation. (D) The time-course of caspase activation was evaluated by time-lapse images like those in C using one ×100 field, representative of three other. Cell conjugates showing asymmetric levels of green fluorescence as in C (diamonds) were distinguished from isolated green cells (circles). (E) Time-course of cell blebbing was evaluated from bright field images scoring isolated and conjugated cells as in D. Results from n = 4 separate experiments showed statistically significant differences between isolated and conjugated blebbing cells after 30 min of Fas stimulation (P = 0.03, Mann-Whitney).
Figure 2
Figure 2
Fas signalling increases the formation of connecting membrane nanotubes. (A) The image shows the cumulative z-projection of 29 sections of cells, which were surface stained with red HPA after internalization of FITC-conjugated anti-CD81 as described earlier [13]. Arrows point to the various connecting nanotubes that emerge at different equatorial levels along the z axis. Deconvolved images were taken with a × 100 objective. (B) The image is slightly enlarged from the box area in A and tilted by an angle of 150 degrees to better show the long connecting nanotube sprouting from the central part of the top cell. Only the surface red staining is shown. (C) Cells were incubated with 50 nM Mitotracker® red (MTR) and then with liposomes containing fluorescent BODIPY-phosphatidylcholine (Molecular Probes) plus BODIPY-monolysocardiolipin (Degli Esposti, unpublished) mixed with non-fluorescent membrane phospholipids. After equilibration and washing, fluorescent lipids were predominantly endocytosed and accumulated in nanotubular protrusions (arrow), similar to carbocyanine lipophilic dyes (cf. [21]). (D) After 30 min of treatment with the Fas-activating antibody CH-11, Jurkat cells were fixed, permeabilized with 0.2% saponin and then incubated with 10 μM Texas red-conjugated phalloidin (red, to stain F-actin) and then stained with 2 μg/ml of AlexaFluor488-conjugated HPA (green). Arrow indicates the large connecting nanotube enriched in actin (enlarged).
Figure 3
Figure 3
Fas-enhanced nanotubes facilitate intercellular membrane transfer. (A) Connecting nanotubes were observed in live Jurkat cells using bright field images (×100 objective). Every nanotube formed was cumulatively counted, even if transient (average nanotube duration was 15.4 min after Fas stimulation, cf. Supplementary information, Movie S1). Cells were treated with FasL or CH-11 6 min before data acquisition. (B) Connecting membrane nanotubes transiently increased after Fas activation with either FasL or CH-11 for 30 min. Data represent averages ± S.D. with Fas stimulation before (control, n = 5 experiments) or after pre-treatment with 0.1 μg/ml CdTXB or 20 μM secramine A for 30 min (n = 3 experiments), which allowed full cell permeation and Rho GTPase inhibition [13]. Differences were highly significant after 20 min (e.g., P < 0.02, Mann-Whitney). (C) Jurkat cells were treated with 50 μM z-VAD for 30 min before being separately stained with a dual PE-Cy5 conjugate of anti-CD59 (1:15) or Alexa488-conjugated CtxB (green), and then mixed in the presence of 0.5 μg/ml of CH-11 for 30 min (including attachment on cover slips). After fixation, cells were permeabilized with 0.1% saponin and then stained with Alexa Fluor 350-conjugated HPA (blue). Deconvolution microscopy (×60 objective) was undertaken with a PE excitation filter and a Cy5 emission filter (coloured in red) to minimize bleeding with the green channel. Of note, anti-CD59 antibody and CtxB conjugates were not activating their target molecules on the cell surface [13]. Moreover, CtxB was used as in the studies of clathrin-independent endocytosis [13] rather than a reporter for lipid rafts [2, 39]. Arrowheads point to CD59-labelled elements uni-laterally migrating along the connecting nanotube (large arrow) and then inserted in the CtxB-stained cell. (D) Pharmacological modulation of connecting membrane nanotubes and uni-lateral exchange of CD59 was evaluated after Fas activation for 30 min as in C. Cells were pre-treated with secramine and CdTXB as in the experiment of part B, while z-VAD and PP2 were added at 50 and 10 μM, respectively, and incubated for 30 min before CH-11 treatment. Control cells were treated with a non-activating anti-Fas mAb. Histograms represent the average ± S.D. of n = 4 with inhibitors and n = 6 experiments without inhibitors. Differences were statistically significant for secramine and CdTXB only (P < 0.03, Mann-Whitney).
Figure 4
Figure 4
Fas signalling enhances bidirectional exchanges along nanotubes. (A) An aliquot of Jurkat cells were pre-stained green with anti-CD59 and then mixed with another aliquot that had been stained with allophycocyanin (APC)-conjugated anti-CD81 in the presence of CH-11 for 30 min, including attachment on cover slips. After fixation, cells were stained with blue HPA and imaged as in the experiment of Figure 3C. Note the connecting membrane nanotube (arrow) that carries both CD59-labelled membranes and CD81-labelled membranes (arrowheads). (B) The frequency of occurrence of nanotubes containing only CD59 or CD81 staining was computed for n = 4 separate experiments like that in A. No significant difference was found with various tests. (C) Pharmacological profile of the bidirectional exchange of CD59- and CD81-labelled membranes was evaluated by counting connecting nanotubes that contained either CD59 alone (grey) or both CD59 and CD81 (black). Nanotubes that did not contain any labelled particle after background subtraction were scored as empty (white). Histograms represent the average of two separate experiments with approx. 240 nanotubes analysed. Inhibitors were pre-incubated as in the experiments of Figure 3. (D) A membrane nanotube connects a YFP-expressing 293T cell (top) with a Jurkat cell labelled with red HPA (bottom). Labelled Jurkat cells in RB buffer were layered over cover slips with attached 293T cells 24 h after YFP transfection and incubated for 30 min in the presence of 0.5 μg/ml CH-11 before fixation. Note the red-labelled elements (arrowheads in the left panel) that migrate along the nanotube (arrow) and the bright green element (arrowhead in central panel) that is associated with the red cell. (E) A large membrane nanotube connects a YFP-transfected cell with a Jurkat cell (bottom) in the same settings as in D, but with a clear diffusion of cytosolic YFP into the red cell (arrowhead). A red-labelled membrane element is also present in the 293T cell (arrowhead in left panel).
Figure 5
Figure 5
Membrane nanotubes transfer active caspases and contribute to death propagation. (A) One-half of a Jurkat suspension was treated with CH-11 for 30 min, to activate caspases in advance, then washed and mixed to the other half that was left untreated. After 15-min attachment on cover slips, cells were fixed, permeabilized, stained for active caspase-3 and surface decorated with red HPA as in the experiment of Figure 1B. Note the nanotube (arrow) connecting a Fas-activated cell (top) and containing elements positive for active caspase-3 that migrate into the bottom cell (thin arrows). (B) The experiment was conducted as in A, except that the aliquot of untreated cells was allowed to endocytose red HPA before mixing and attachment. Note the connecting nanotubes containing active caspase-3 (arrows) between asymmetrically stained cells. The images show representative ×60 fields of Jurkat cells following 40 min incubation with CH-11 (cf. Figure 1B). (C) Histograms represent the averages ± S.D. of the positive scores for active caspase-3 obtained from n = 4 separate experiments as in D plus one performed with Imagen-Biotech platform (cf. Supplementary information, Figure S1B). All results were significantly higher than the values of control cells (treated with a non-activating anti-Fas antibody). However, samples with Rho GTPase inhibitors showed very different values, for both isolated and conjugated cells, from those with CH-11 alone (P = 0.02 for conjugated cells plus CdTXB and P = 0.03 for cells with secramine, Mann-Whitney). Nearly 8 000 cells were examined.
Figure 6
Figure 6
Fas signalling enhances membrane and cytosol exchange in primary CD4+ T cells. (A) CD4+ T cells, activated with PHA, were separately stained with 5 μg/ml TRITC-WGA (red) or FITC-conjugated anti-CD59 (green, incubated at 1:10), washed and then mixed as in the experiment of Figure 3C (but with FasL instead of CH-11). Representative couplings of FasL-treated cells (bottom panel) show increased exchange of red-labelled membranes (arrow heads) and also a connecting nanotube (thick arrow). (B) CD4+ T cells, activated with ionomycin and PMA, were separately stained with green anti-CD59 and infrared anti-CD81, and then treated as in the experiment of Figure 4A, except that AlexaFluor350-conjugated WGA was used for surface decoration (blue). The main image is the projection of 12 central z sections showing a thin connecting nanotube (arrow) that contains both CD81 (red) and CD59 (green) membrane elements in transit between cells. The insert shows the projection of the full set of 24 sections for the same ×60 image. (C) Activated CD4+ cells T cells were separately stained red with PKH 26 and green with 0.5 μM CFSE, a cytosolic marker [20]. In the dot plot obtained after filtering out cell conjugates [30], cells stained with PKH26 and CFSE were completely separated from each other in the control (left) but showed a population of double positive after 30 min of FasL treatment (right). Data is representative of four separate experiments. (D) Quantitative evaluation of the exchange of cytosolic (CFSE, light blue histograms) and membrane (PKH67, dark green histograms) elements was conducted in n = 4 experiments like that in C but using the method of Poupot and Fournié [22]. The decrease in the average exchange of both markers that was observed after pre-treatment with PP2 was not significant, while that observed after pre-treatment with latrunculin was significant at P = 0.03 (Mann-Whitney).
Figure 7
Figure 7
T cells from ALPS patients are defective in membrane nanotubes and transfer. (A) Quantitative evaluation of connecting nanotubes and CD59 spreading, a reporter of Fas-enhanced endocytosis [13], was conducted in two equivalent experiments using activated CD4+ T lymphocytes as in the experiment of Figure 6B; the histograms represent the average values obtained after analysing the indicated number of cells. (B) Activated CD4+ T cells from healthy donors (normal) and the ALPS patient (bottom panels) were separately stained with red WGA and green CtxB, and then mixed in the presence of FasL for 30 min before fixing and imaging with deconvolution microscopy (×100 objective). Arrows indicate membrane elements that exchange between the conjugated cells. (C) Data show the cumulative analysis of n = 5 experiments like that in B by scoring > 100 cells for each sample from three ALPS patients (besides the one used in parts A-C, a second harbouring the homozygote deletion c475-488 and a third with the mosaic mutation c677-1G>T within the Fas gene). Note that the maximal score for each type of cells would be 50%. Differences between ALPS and normal cells were significant: P < 0.05 for ‘green with red’ or ‘red with green’ and P < 0.02 for ‘green alone’ (Mann-Whitney).
Figure 8
Figure 8
Nanotubes transfer FasL among T cells. (A) Primary CD4+ cells from a normal individual and the same ALPS patient used in the experiment of Figure 7A were activated with ionomycin and PHA, and then IL-2. After washing and suspension in RB buffer, normal T cells were incubated with APC-conjugated anti-CD81, while those from the ALPS patient were incubated with FITC-conjugated anti-CD59 for 20 min to induce effective internalization of the antibodies. Subsequent to washing, normal and ALPS cells were mixed in a 2:1 ratio and treated with CH-11. After fixation and permeabilization with saponin, cells were labelled with PE-conjugated NOK-1 (FasL) and decorated with WGA (blue). Deconvolved images were then taken with a ×100 objective and split in the indicated colours for analysis. Note that no CD81-positive or CD59-positive element was exchanged between the normal cell conjugated to the ALPS cell, while a connecting nanotube (arrow) transferred FasL-positive elements between normal cells. FasL staining in the ALPS cell remained clustered, contrary to the dispersed distribution in normal cells. (B) Jurkat cells were treated with CH-11 for 20 min and then immunostained with PE-conjugated NOK-1 (red). After counterstaining the cell surface with green HPA, cells were imaged with a ×100 objective. FasL is present within the connecting nanotube (arrow). (C) Enhanced internalization of NOK-1 was conducted together with blue HPA as a tracer. Washed blue cells were then mixed with unlabeled cells in the presence of CH-11 for 15 min. After fixation and permeabilization, the total complement of endogenous FasL was stained with a goat antibody followed by Cy3-conjugated anti-goat (red). Conversely, the previously internalized NOK-1 was stained with FITC-labelled anti-mouse (green). Both NOK-1 and blue HPA were found into connected cells exhibiting predominant red staining for non-internalized FasL. Deconvolved images were obtained with a ×100 objective. The thick arrow indicates a connecting nanotube containing FasL and arrowheads indicate elements exhibiting co-localized staining with anti-FasL antibodies. (D) Membrane nanotubes containing FasL increased during Fas stimulation, but not in the presence of CdTXB (circles, averages of two experiments). Data without the inhibitor (squares) were the averages of n = 6 experiments. Approximately, 500 nanotubes were evaluated. (E) Internalized anti-FasL antibodies reduce the extent of blebbing after 40 min of cumulative treatment with CH-11. Cells not exposed to anti-FasL antibodies exhibited more blebbing than cells with internalized antibodies (P = 0.012, Mann-Whitney, and P = 0.002, ANOVA). Data was obtained from four to six separate experiments after scoring a total of 1 560 cells. Results of a parallel experiment with live cells showed an average of 9.1 and 21.3% blebbing in the presence and absence of external NOK-1, respectively.

References

    1. Green DR, Droin N, Pinkoski M. Activation-induced cell death in T cells. Immunol Rev. 2003;193:70–81. - PubMed
    1. Siegel RM, Muppidi JR, Sarker M, Lobito A, Jen M, Martin D, et al. SPOTS: signaling protein oligomeric transduction structures are early mediators of death receptor-induced apoptosis at the plasma membrane. J Cell Biol. 2004;167:735–744. - PMC - PubMed
    1. Peter ME, Krammer PH. The CD95(APO-1/Fas) DISC and beyond. Cell Death Differ. 2003;10:26–35. - PubMed
    1. Algeciras-Schimnich A, Shen L, Barnhart BC, Murmann AE, Burkhardt JK, Peter ME. Molecular ordering of the initial signaling events of CD95. Mol Cell Biol. 2002;22:207–220. - PMC - PubMed
    1. Rao VK, Straus SE. Causes and consequences of the auto-immune lymphoproliferative syndrome. Hematology. 2006;11:15–23. - PubMed

Publication types

MeSH terms