

Estimating dormant and active hematopoietic stem cell kinetics through extensive modeling of bromodeoxyuridine label-retaining cell dynamics
- PMID: 19771180
- PMCID: PMC2745578
- DOI: 10.1371/journal.pone.0006972
Estimating dormant and active hematopoietic stem cell kinetics through extensive modeling of bromodeoxyuridine label-retaining cell dynamics
Abstract
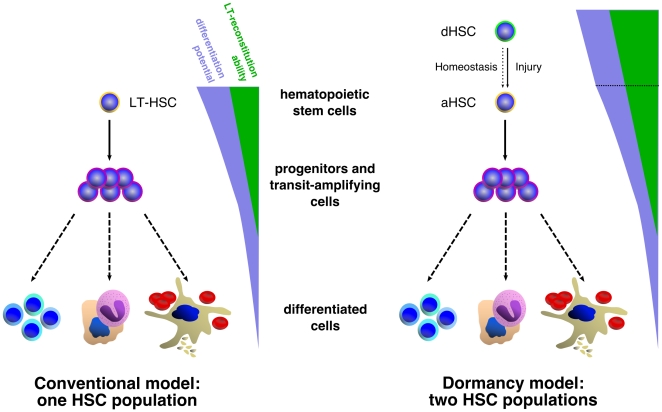
Bone marrow hematopoietic stem cells (HSCs) are responsible for both lifelong daily maintenance of all blood cells and for repair after cell loss. Until recently the cellular mechanisms by which HSCs accomplish these two very different tasks remained an open question. Biological evidence has now been found for the existence of two related mouse HSC populations. First, a dormant HSC (d-HSC) population which harbors the highest self-renewal potential of all blood cells but is only induced into active self-renewal in response to hematopoietic stress. And second, an active HSC (a-HSC) subset that by and large produces the progenitors and mature cells required for maintenance of day-to-day hematopoiesis. Here we present computational analyses further supporting the d-HSC concept through extensive modeling of experimental DNA label-retaining cell (LRC) data. Our conclusion that the presence of a slowly dividing subpopulation of HSCs is the most likely explanation (amongst the various possible causes including stochastic cellular variation) of the observed long term Bromodeoxyuridine (BrdU) retention, is confirmed by the deterministic and stochastic models presented here. Moreover, modeling both HSC BrdU uptake and dilution in three stages and careful treatment of the BrdU detection sensitivity permitted improved estimates of HSC turnover rates. This analysis predicts that d-HSCs cycle about once every 149-193 days and a-HSCs about once every 28-36 days. We further predict that, using LRC assays, a 75%-92.5% purification of d-HSCs can be achieved after 59-130 days of chase. Interestingly, the d-HSC proportion is now estimated to be around 30-45% of total HSCs - more than twice that of our previous estimate.
Conflict of interest statement
Figures
 Sca1
Sca1 CD34
CD34 CD150
CD150 CD48
CD48 CD135
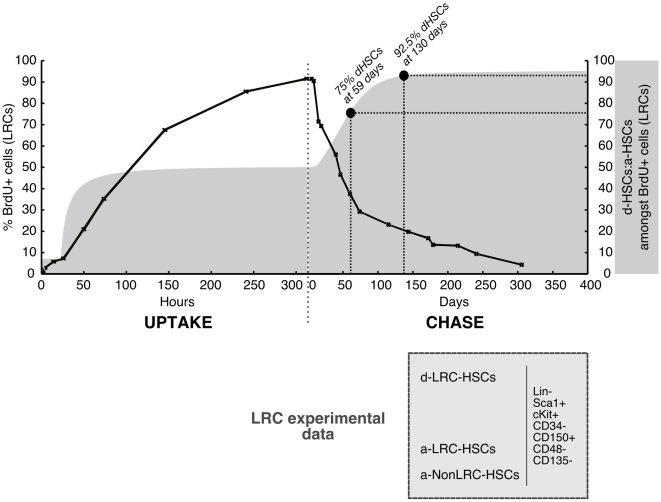
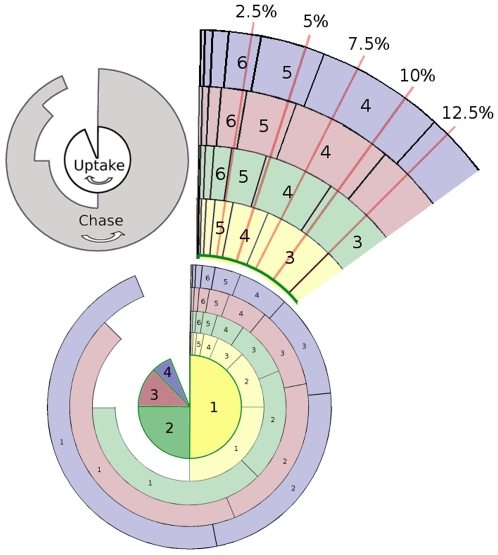
CD135 ) as determined experimentally (solid black line) overlaid with the relative proportion of d-HSCs (dormant HSC) and a-HSCs (active HSCs) amongst BrdU
 phenotypic HSCs estimated by our modeling (dark grey shaded curve). The populations that can be found at any time point of a LRC experiment amongst phenotypic HSCs are indicated in the light grey box. The time points of chase at which the d-HSCs represent 75% and 92.5% of the LRC phenotypic HSCs are indicated by solid black circles.
References
-
- Wilson A, Oser GM, Jaworski M, Blanco-Bose WE, Laurenti E, et al. Dormant and self-renewing hematopoietic stem cells and their niches. Ann N Y Acad Sci. 2007;1106:64–75. - PubMed
-
- Wilson A, Laurenti E, Oser G, van der Wath RC, Blanco-Bose W, et al. Hematopoietic stem cells reversibly switch from dormancy to self-renewal during homeostasis and repair. Cell. 2008;135:1118–1129. - PubMed
-
- Cotsarelis G, Sun TT, Lavker RM. Label-retaining cells reside in the bulge area of pilosebaceous unit: implications for follicular stem cells, hair cycle, and skin carcinogenesis. Cell. 1990;61:1329–1337. - PubMed
Publication types
MeSH terms
Substances
LinkOut - more resources
Full Text Sources
Medical
