

Review
doi: 10.1039/b901966a.
Epub 2009 Aug 4.
The fluorescent protein palette: tools for cellular imaging
Affiliations
- PMID: 19771335
- PMCID: PMC2910338
- DOI: 10.1039/b901966a
Item in Clipboard
Review
The fluorescent protein palette: tools for cellular imaging
Chem Soc Rev.
2009 Oct.
Erratum in
- Chem Soc Rev. 2011 Dec;40(12):5923
Abstract
This critical review provides an overview of the continually expanding family of fluorescent proteins (FPs) that have become essential tools for studies of cell biology and physiology. Here, we describe the characteristics of the genetically encoded fluorescent markers that now span the visible spectrum from deep blue to deep red. We identify some of the novel FPs that have unusual characteristics that make them useful reporters of the dynamic behaviors of proteins inside cells, and describe how many different optical methods can be combined with the FPs to provide quantitative measurements in living systems (227 references).
Figures
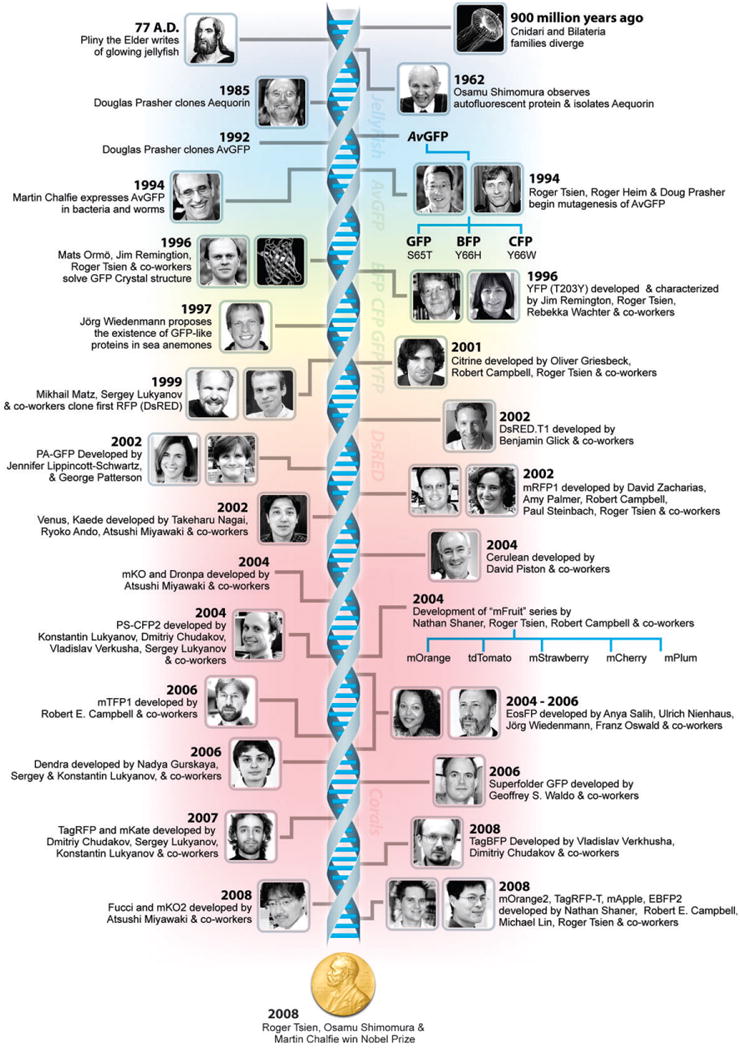
Timeline of important events in fluorescent protein technology.
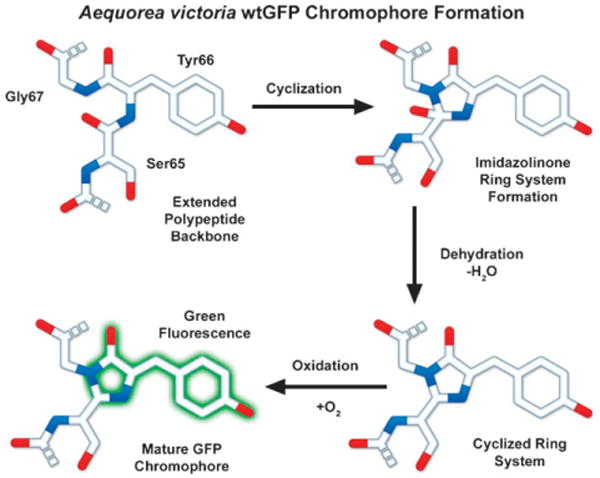
Steps in the formation of the A. victoria wtGFP chromophore.
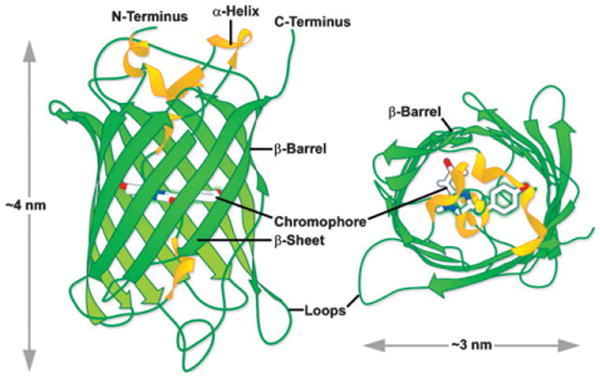
A. victoria GFP β-barrel architecture and approximate dimensions. Drawing based on Protein Data Bank ID: 1w7s.
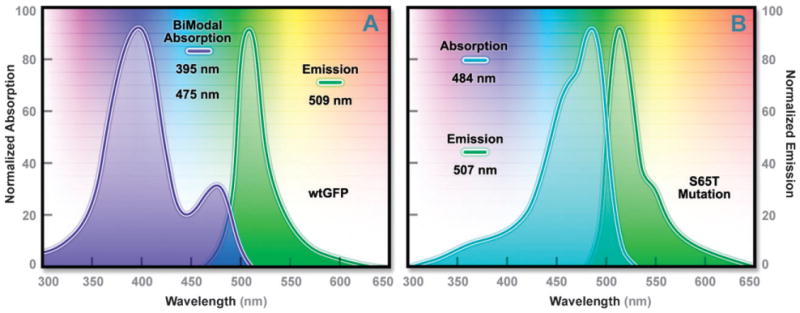
Absorption and emission spectral profiles of (A) wild-type A. victoria GFP; and (B) the improved S65T derivative.
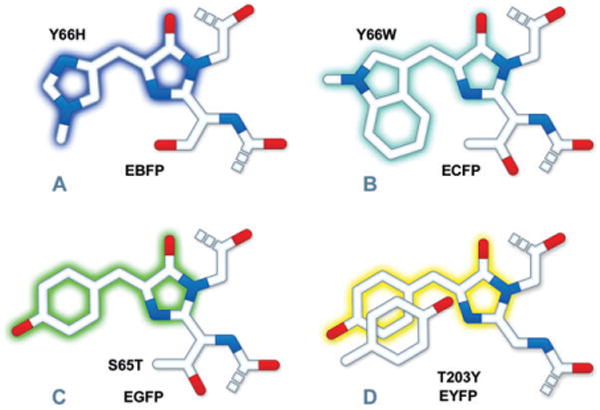
Chromophore structures of: (A) BFP derivatives; (B) CFP derivatives; (C) EGFP derivatives; (D) YFP derivatives. The tryptophan residue (Trp66) in (B) is illustrated in the cis conformation as occurs for Cerulean derivatives rather than the trans isomer that is common to CFP and related variants. Portions of the chromophores that are conjugated and give rise to fluorescence are shaded with colors corresponding to the emission spectral profile.
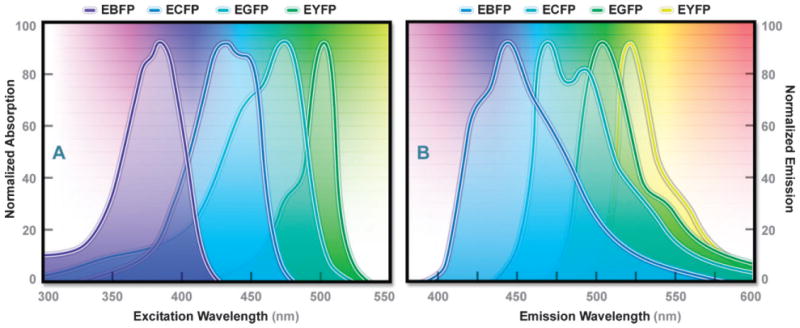
Absorption (A) and emission (B) spectral profiles of the enhanced Aequorea-GFP derivatives: EBFP, ECFP, EGFP, and EYFP.
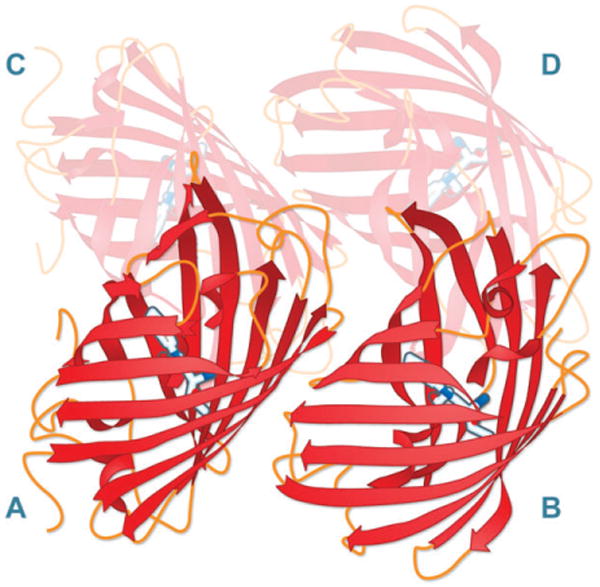
Tetramer formation in native DsRed FP. Each of the protomers are individually lettered (A–D). Drawing based on Protein Data Bank ID: 1g7k.
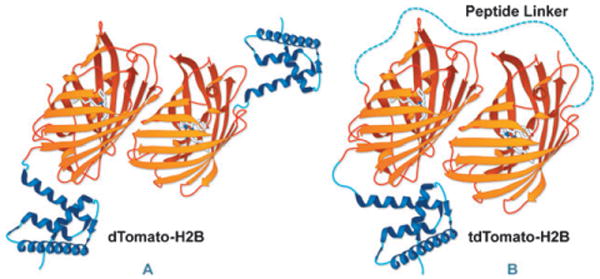
Using tandem dimers to simulate “pseudo-monomer” function in FPs. (A) dimeric Tomato FP constrains fusion tags due to intermolecular dimerization, which can be relieved (B) by linking two copies of the dimeric FP with a short peptide linker.
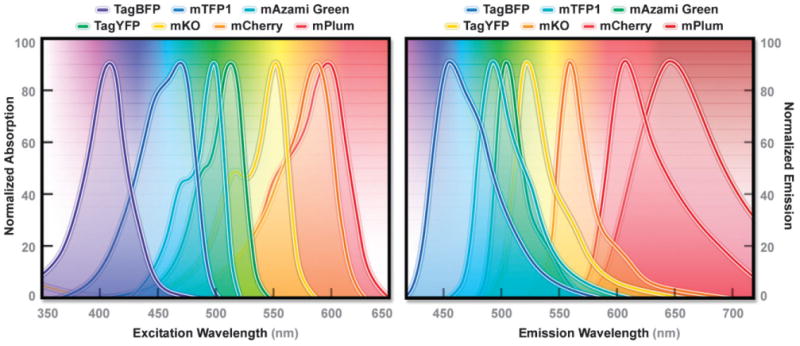
Absorption (A) and emission (B) spectral profiles of high-performance Anthozoa FP derivatives: mTagBFP, mTFP1, mAzami Green, TagYFP, mCherry, and mPlum.
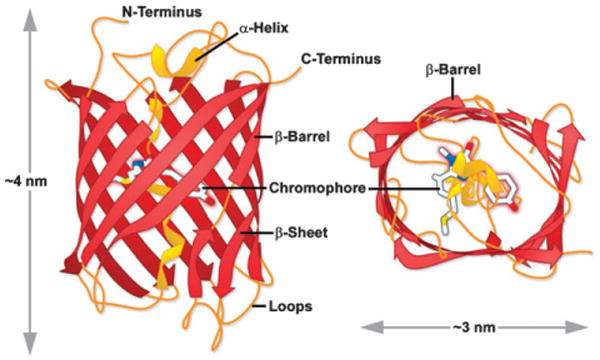
mCherry FP β-barrel architecture and approximate dimensions. In general, Anthozoa FPs have a more elliptical symmetry to the β-barrel than do A. victoria GFP derivatives (see Fig. 3). Drawing based on Protein Data Bank ID: 2h5q.
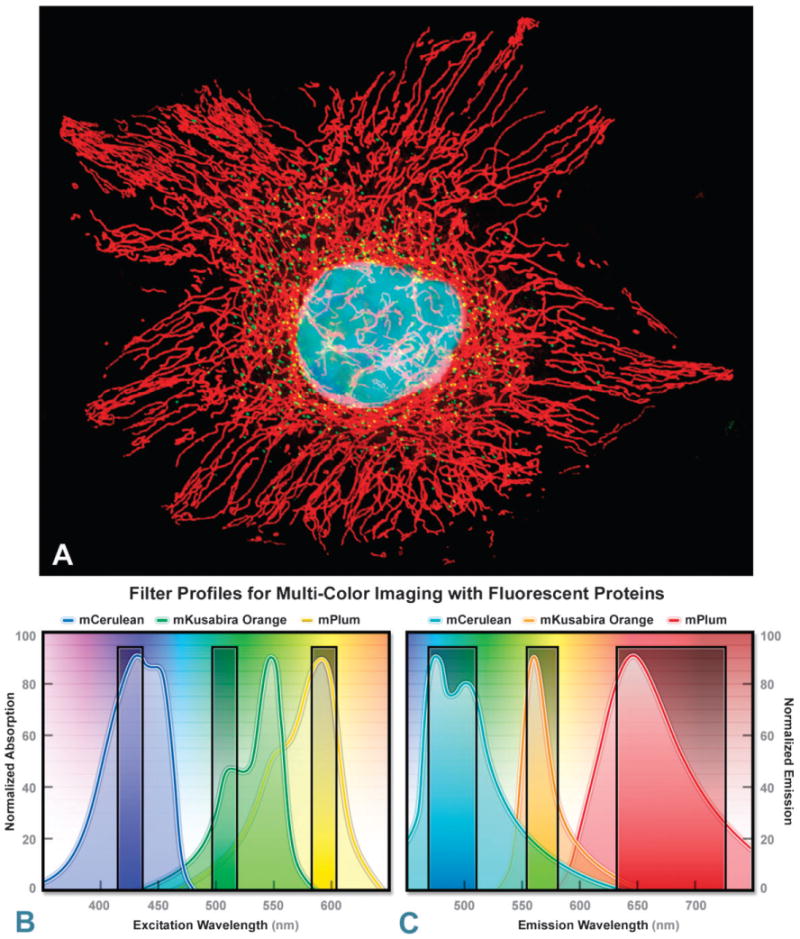
Optimized fluorescence filter combinations for multicolor imaging of three FPs spanning the cyan to far-red wavelength regions. (A) Widefield fluorescence image of a single HeLa cells labeled with mCerulean (human histone H2B; nucleus; pseudocolored cyan), mKusabira Orange (peroxisomes; pseudocolored green), and mPlum (mitochondrial targeting signal; pseudocolored red). (B) Excitation filters optimized to avoid cross excitation for mCerulean, mKusabira Orange, and mPlum FPs having center wavelengths of 425, 508, and 585 nm, respectively. The bandwidth of the excitation filters is 20 nm. (C) Emission filters optimized for the same probes having center wavelengths of 480, 564, and 675 nm with bandwidths of 40, 28, and 100 nm, respectively.
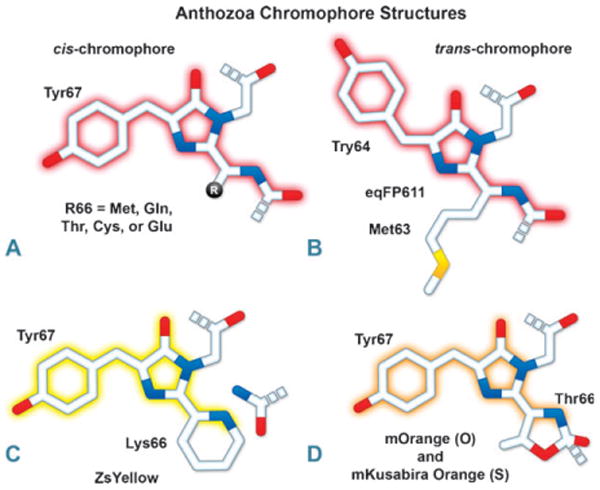
Chromophore structural variation in yellow, orange, and red FPs. (A) FPs derived from DsRed and other reef coral organisms thought to have a cis-chromophore. The residue at position 66 can be Met, Gln, Thr, Cys, or Glu. (B) eqFP611, a red variant derived from E. quadricolor, is the only known FP featuring a trans-chromophore (see Section 3.3). (C) ZsYellow (also zFP538), derived from the button polyp Zoanthus, features a novel three-ring chromophore that is created when the lysine residue at position 66 cyclizes with its own α-carbon to form a tetrahydropyridine ring conjugated to the chromophore. (D) mOrange and mKO also feature a three-ring chromophore where Thr66 or the equivalent cysteine cyclizes with the preceding carbonyl carbon to yield a partially conjugated oxazole or thiazole ring.
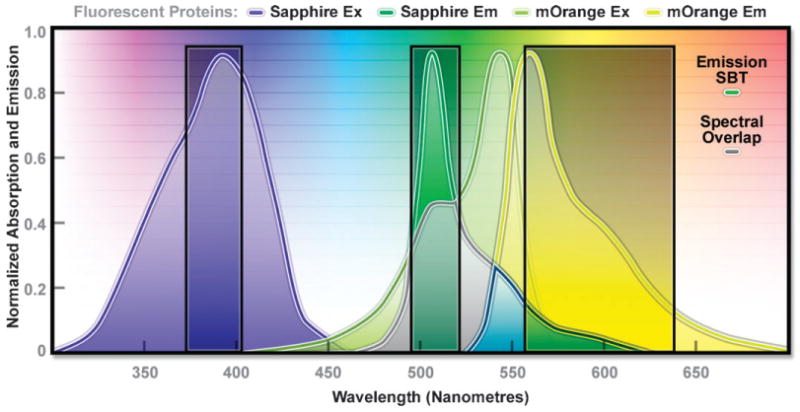
The combination of Sapphire and mOrange fluorescent proteins as a FRET pair. Illustrated are the absorption and emission spectral profiles of the two probes along with the recommended filter sets. The overlap region between the emission spectrum of Sapphire and the absorption spectrum of mOrange is presented with a gray fill, while the emission spectral bleed-through is depicted by the blue fill (see Section 5.3.2). The excitation filter is centered at 395 nm with a 30 nm bandwidth (395/30), and the 512/26 emission filter enables analysis of the donor fluorescence emission (Sapphire) without contamination of signal from the acceptor (mOrange). The wideband 600/80 acceptor filter collects a significant amount of signal from mOrange with less than 10% bleed-through of the Sapphire fluorescence. A dichromatic mirror having a cut-on wavelength of 500 nm (not illustrated) should be utilized with this filter combination.
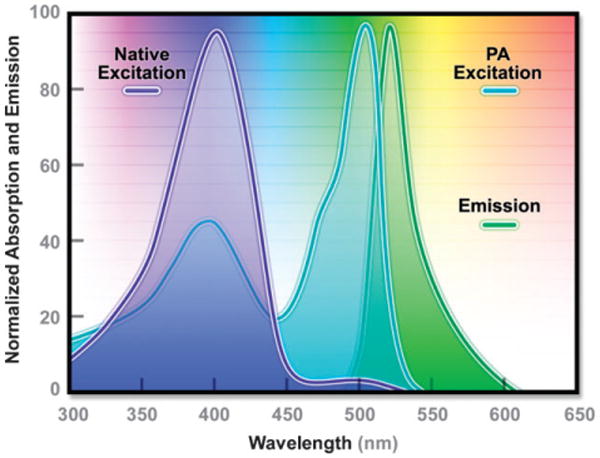
Absorption and emission spectral profiles of PA-GFP.
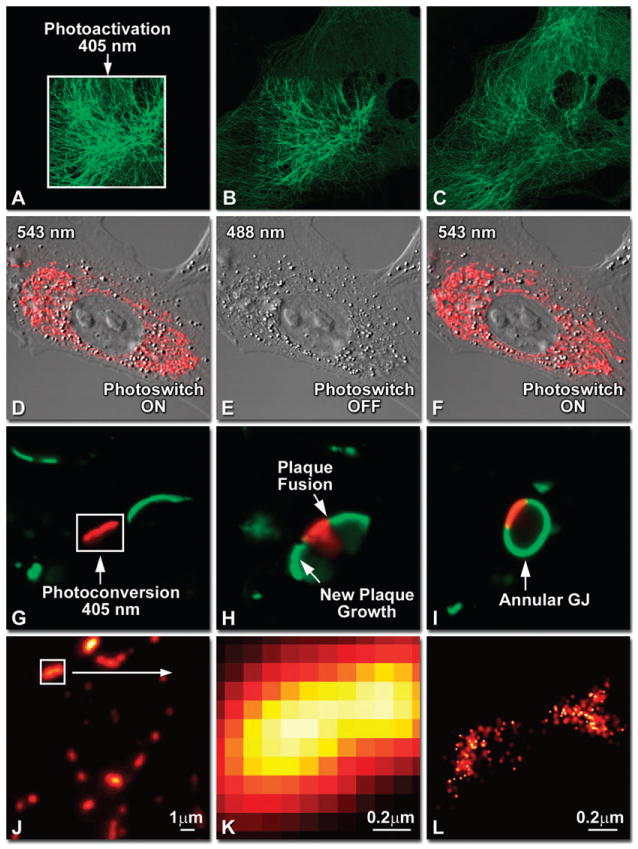
Optical highlighter FPs in action imaged with laser scanning confocal microscopy. (A–C) Photoactivation of mPA-GFP-tubulin in opossum kidney (OK cell line) epithelial cells, (A) rectangular region of interest is illuminated at 405 nm for 5 s, t = 0. (B) The photoactivated tubulin chimera slowly migrates to other portions of the cell, t = 25 minutes. (C) The microtubule network gains more intensity at t = 60 minutes. (D–F) Photoswitching of the mitochondria with fusion of KFP1 to a mitochondria targeting sequence in fox lung cells. (D) Labeled mitochondria imaged with 543 nm laser in both fluorescence and differential interference contrast, t = 0. (E) After completely photoswitching the labeled chimera “off” with 488 nm illumination, the mitochondria now appear devoid of fluorescence, t = 3 min. (F) KFP1 label in mitochondria, reactivated with illumination at 543 nm, does not significantly photobleach after 5 rounds of photoswitching. (G–I) Photoconversion of gap junctions labeled with mEos2–Cx43 in HeLa cells. (G) Photoconversion of a gap junction plaque (red) in a selected region (white box) with 405 nm illumination at t = 0. (H) New plaque growth and fusion of a non-converted plaque, t = 50 min. (I) Formation of annular gap junction with photoconverted region, t = 80 min. (J–L) Superresolution microscopy (PALM) imaging of tdEos-mitochondria in fox lung cells. (J) Widefield TIRF image of a mitochondria field near the nucleus. (K) Summed PALM image of boxed region in (J). (L) PALM image of the mitochondrial fusion.
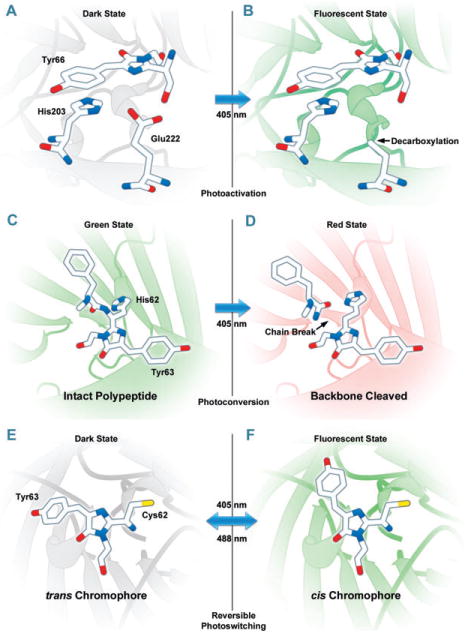
Photoactivation, photoconversion and photoswitching mechanisms for optical highlighter FPs. (A, B) Photoactivation of PA-GFP (illustrated) and PS-CFP2 is believed to occur due to decarboxylation of Glu222 followed by conversion of the chromophore from a neutral to anionic state. (C, D) Green to red photoconversion for Kaede, KikGR, Dendra2, and Eos, all of which contain the HYG chromophore, occurs when the FP is illuminated with ultraviolet or violet radiation (405 nm) to induce cleavage between the amide nitrogen and α-carbon atoms in the histidine 62 residue leading to subsequent formation of a conjugated dual imidazole ring system. (E, F) Photoswitching of Dronpa involves cis–trans photoisomerization induced by alternating radiation between 405 nm and 488 nm. A similar isomerization mechanism is suggested to operate in mTFP0.7 and KFP1.
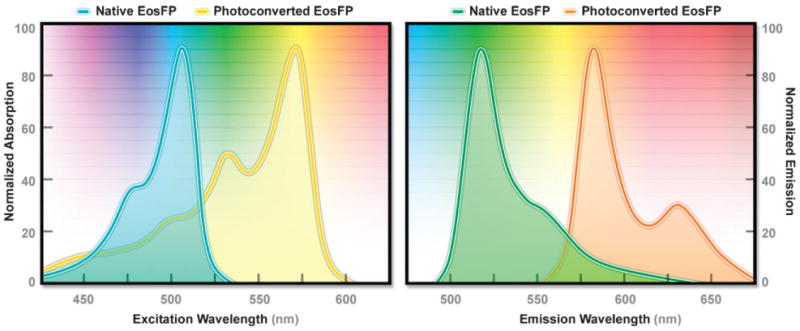
Absorption and emission spectral profiles of EosFP.
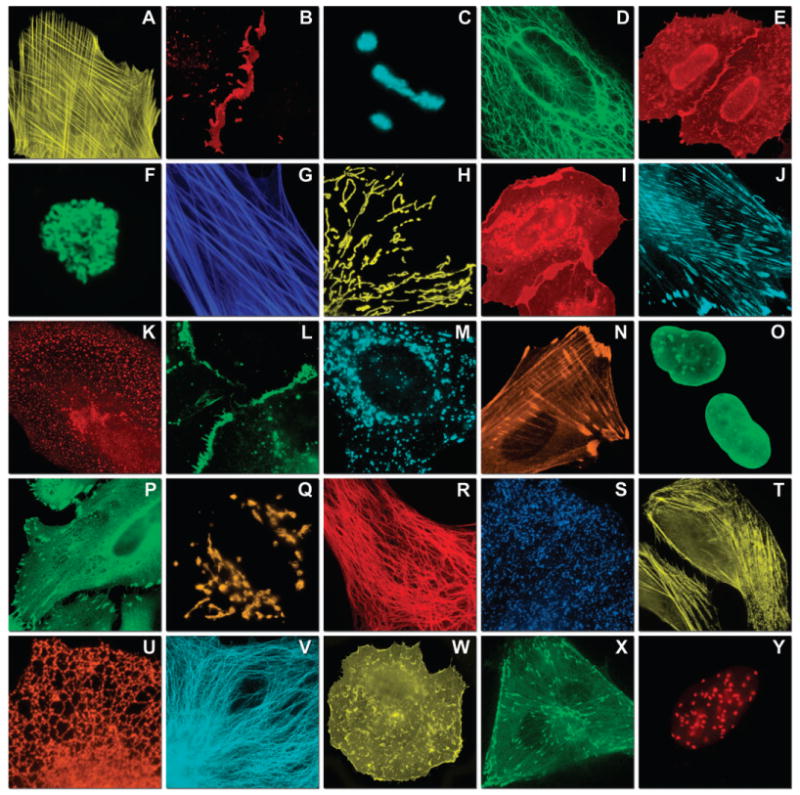
Fluorescence imaging of FP fusion constructs targeting subcellular locations. Construct images are listed as: FP-fusion partner-N- or C-terminal (with respect to the FP)—number of linker amino acids. (A) mOrange2-β-actin-C-7. (B) mApple-Cx43-N-7. (C) mTFP1-fibrillarin-C-7. (D) mWasabi-cytokeratin-N-17. (E) mRuby-annexin (A4)-C-12. (F) mEGFP-H2B-N-6. (G) EBFP2-β-actin-C-7. (H) mTagRFP-T-mitochondria-N-7. (I) mCherry-C-Src-N-7. (J) mCerulean-paxillin-N-22. (K) mKate-clathrin (light chain)-C-15. (L) mCitrine-VE-cadherin-N-10. (M) TagCFP-lysosomes-C-20. (N) TagRFP-zyxin-N-7. (O) superfolderGFP-lamin B1-C-10. (P) EGFP-α-v-integrin-N-9. (Q) tdTomato-Golgi-N-7. (R) mStrawberry-vimentin-N-7. (S) TagBFP-Rab-11a-C-7. (T) mKO2-LC-myosin-N-7. (U) DsRed2-endoplasmic reticulum-N-5. (V) ECFP-α-tubulin-C-6. (W) tdTurboRFP-farnesyl-C-5. (X) mEmerald-EB3-N-7. (Y) mPlum-CENP-B-N-22.
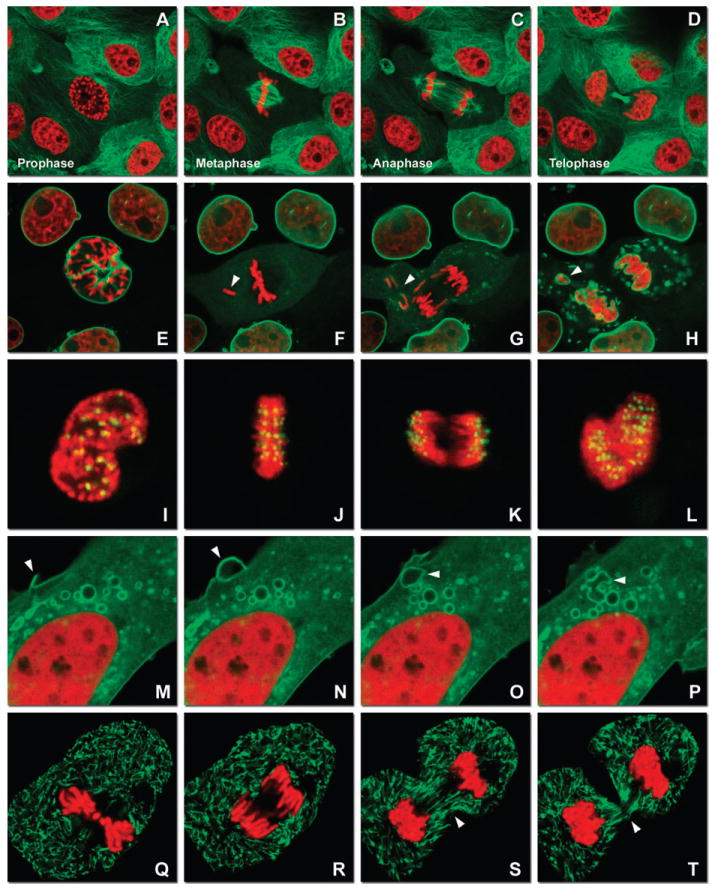
Fluorescent protein reporters in action imaged with spinning disk confocal and widefield microscopy. (A–D) Observing mitosis in dual-labeled normal pig kidney (LLC-PK1 cell line) epithelial cells stably expressing mCherry-H2B (histones) and mEmerald-α-tubulin. (A) A cell in prophase is captured adjacent to cells in interphase, t = 0. (B) The cell forms a spindle and enters metaphase, t = 20 min. (C) During anaphase, the spindle poles translocate to opposite sides of the cell, pulling the condensed chromosomes along, t = 60 min. (D) The chromosomes begin to decondense during telophase as the daughter cells recover from cell division (mid-body visible). (E–H) Dispersion of the nuclear envelope during mitosis. HeLa cells expressing mRuby-H2B and mEmerald-lamin-B1 are imaged undergoing mitosis. (E) Late prophase with the nuclear envelope intact. (F) In metaphase, the nuclear envelope signal is dispersed in the cytoplasm. Note the detached chromosome (arrow). (G) During late anaphase, the nuclear envelope begins to reform. Note the independent mitosis event for the detached chromosome (arrow). (H) Telophase nuclei decondense and the nuclear envelope reforms. Note the separate nuclear envelope formation on the detached chromosomes (arrow). (I–L) HeLa cells labeled with mApple-H2B and mEmerald-CENPB undergoing mitosis. (I) Prophase nucleus showing labeled condensed chromosomes (red) and centromeres (green). Centromeres and chromosomes are visible during cell division in metaphase (J), anaphase (K), and telophase (L). (M–P) Vesicle formation by C-Src in U2OS cells labeled with mEmerald-C-Src and mRuby-H2B. Arrows denote formation of a vesicle at the periphery of the plasma membrane. (Q–T) Mitosis in opossum kidney cells labeled with mCherry-H2B and mEGFP-mitochondria. Arrows denote localization of mitochondria to the mid-body region during cell division.
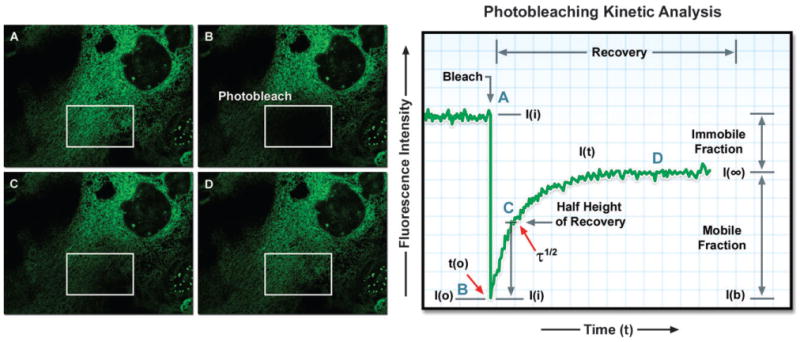
Opossum kidney epithelial cell labeled with EGFP fused to an endoplasmic reticulum targeting sequence. A region of interest (white box) is photobleached with high laser power for 5 seconds (B), effectively quenching all of the fluorescence. Continued monitoring of the cell enables visualization of fluorescence recovery in the photobleached region (C) and (D). A plot of fluorescence intensity versus time enables quantitative analysis of the recovery kinetics and provides information about the diffusion coefficient and mobility for this fluorescent protein chimera.
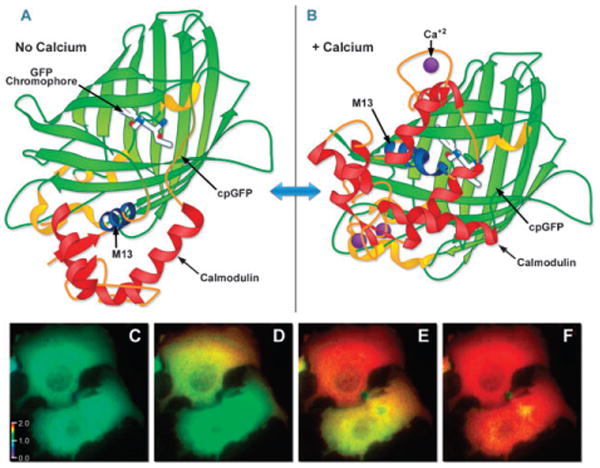
FP biosensor structure and imaging. (A) GCaMP2, a calcium indicator constructed with a circularly permutated EGFP fused to calmodulin and the calmodulin-binding domain of myosin light chain kinase (M13 domain) in the absence of calcium. (B) GCamP2 structure when bound to calcium. Drawings based on Protein Data Bank IDs: 3ekj and 3ek4, respectively. (C–F) Widefield fluorescence calcium imaging in the cytosol of HeLa cells expressing a calcium biosensor. (C) Real color image of two cells, t = 0, histamine (10 μM) added; (D) pseudocolored ratio image of two HeLa cells as a calcium wave initiates in the upper cell, t = 10 s. (E–F) The calcium wave propagates through the cytoplasm of both cells. (E) t = 10.8 s. (F) t = 11.3 s. The level of FRET is indicated by comparison of the pseudocolor signal to the calibration bar in (C).
Similar articles
-
Fluorescent protein tools for studying protein dynamics in living cells: a review.J Biomed Opt. 2008 May-Jun;13(3):031202. doi: 10.1117/1.2939093. J Biomed Opt. 2008. PMID: 18601526 Review.
-
Fluorescent proteins for FRET microscopy: monitoring protein interactions in living cells.Bioessays. 2012 May;34(5):341-50. doi: 10.1002/bies.201100098. Epub 2012 Mar 7. Bioessays. 2012. PMID: 22396229 Free PMC article. Review.
-
The structure and function of fluorescent proteins.Chem Soc Rev. 2009 Oct;38(10):2852-64. doi: 10.1039/b913033k. Epub 2009 Aug 21. Chem Soc Rev. 2009. PMID: 19771332 Review.
-
Live Cell Imaging and Confocal Microscopy.Methods Mol Biol. 2018;1789:117-130. doi: 10.1007/978-1-4939-7856-4_9. Methods Mol Biol. 2018. PMID: 29916075
-
A new configuration of the Zeiss LSM 510 for simultaneous optical separation of green and red fluorescent protein pairs.Cytometry A. 2006 Aug 1;69(8):920-9. doi: 10.1002/cyto.a.20323. Cytometry A. 2006. PMID: 16969813
Cited by
-
A transgenic pig model expressing a CMV-ZsGreen1 reporter across an extensive array of tissues.J Biomed Res. 2020 Dec 25;35(2):163-173. doi: 10.7555/JBR.34.20200111. J Biomed Res. 2020. PMID: 33797416 Free PMC article.
-
What is the Optimal Size of the Quantum Region in Embedding Calculations of Two-Photon Absorption Spectra of Fluorescent Proteins?J Chem Theory Comput. 2020 Oct 13;16(10):6439-6455. doi: 10.1021/acs.jctc.0c00602. Epub 2020 Sep 21. J Chem Theory Comput. 2020. PMID: 32862643 Free PMC article.
-
Förster resonance energy transfer microscopy and spectroscopy for localizing protein-protein interactions in living cells.Cytometry A. 2013 Sep;83(9):780-93. doi: 10.1002/cyto.a.22321. Epub 2013 Jun 27. Cytometry A. 2013. PMID: 23813736 Free PMC article. Review.
-
Acute manipulation of phosphoinositide levels in cells.Methods Cell Biol. 2012;108:187-207. doi: 10.1016/B978-0-12-386487-1.00010-9. Methods Cell Biol. 2012. PMID: 22325604 Free PMC article.
-
Heterogeneous Presynaptic Distribution of Munc13 Isoforms at Retinal Synapses and Identification of an Unconventional Bipolar Cell Type with Dual Expression of Munc13 Isoforms: A Study Using Munc13-EXFP Knock-in Mice.Int J Mol Sci. 2020 Oct 22;21(21):7848. doi: 10.3390/ijms21217848. Int J Mol Sci. 2020. PMID: 33105896 Free PMC article.
References
-
- Pliny, Bostock J, Riley HT. The natural history of Pliny, Book XXXII. Remedies derived from aquatic animals. Chapter 52—Other aquatic productions. Adarca or Calamochnos: three remedies. Reeds: eight remedies. The ink of the sæpia. Gaius Plinius Secundus (Pliny the Elder). AD77. H. G. Bohn; London: 1855.
-
- Matz MV, Lukyanov KA, Lukyanov SA. Bioessays. 2002;24:953–959. - PubMed
-
- Chalfie M, Kain S. Green fluorescent protein: properties, applications, and protocols. 2nd. Wiley-Interscience; Hoboken, NY: 2006.
-
- Shimomura O, Johnson FH, Saiga Y. J Cell Comp Physiol. 1962;59:223–239. - PubMed
-
- Morise H, Shimomura O, Johnson FH, Winant J. Biochemistry. 1974;13:2656–2662. - PubMed
Publication types
MeSH terms
Substances
Grants and funding
LinkOut - more resources
Full Text Sources
Other Literature Sources
Research Materials
Miscellaneous