Stromal thickness in the normal cornea: three-dimensional display with artemis very high-frequency digital ultrasound
- PMID: 19772263
- PMCID: PMC2751865
- DOI: 10.3928/1081597X-20090813-04
Stromal thickness in the normal cornea: three-dimensional display with artemis very high-frequency digital ultrasound
Abstract
Purpose: To characterize the stromal thickness profile in a population of normal eyes.
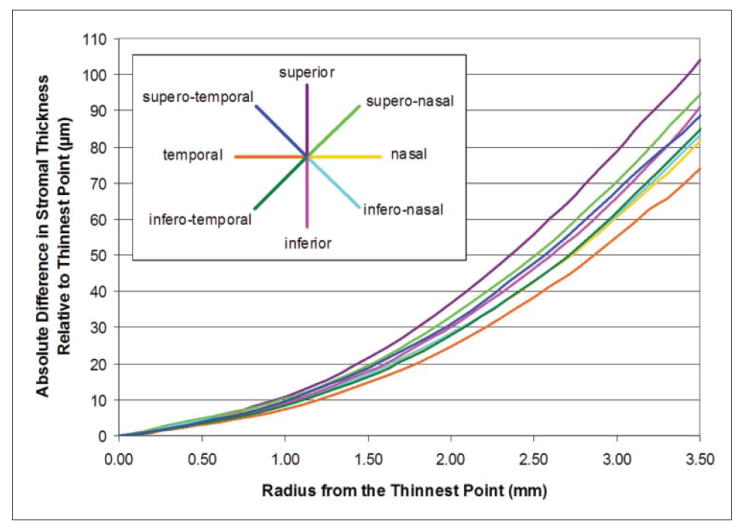
Methods: Stromal thickness profile was measured in vivo by Artemis very high-frequency digital ultrasound scanning (ArcScan, Morrison, Colo) across the central 10-mm corneal diameter on 110 normal eyes. Maps of the average, standard deviation, minimum, maximum, and range of stromal thickness were plotted. The average location of the thinnest stroma was found. The cross-sectional hemi-meridional stromal thickness profile was calculated using annular averaging. The absolute stromal thickness progression relative to the thinnest point was calculated using annular averaging as well as for 8 hemi-meridians individually.
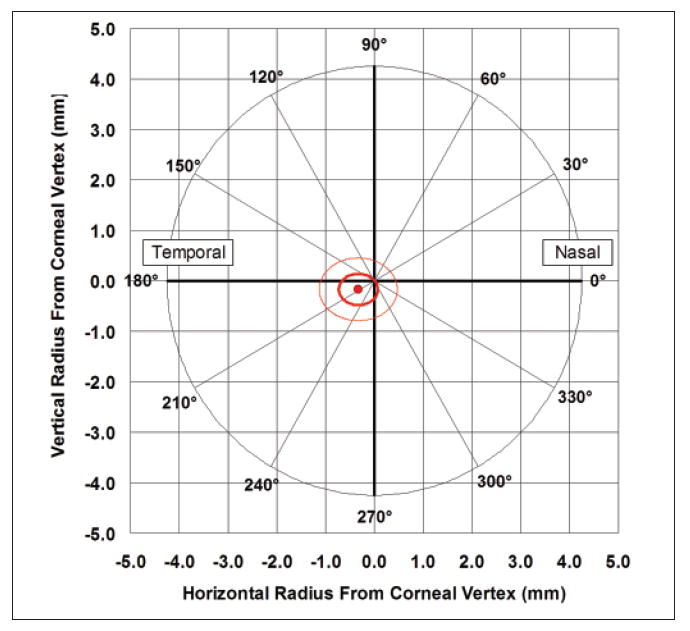
Results: The mean stromal thickness at the corneal vertex and at the thinnest point were 465.4+/-36.9 mum and 461.8+/-37.3 mum, respectively. The thinnest stroma was displaced on average 0.17+/-0.31 mm inferiorly and 0.33+/-0.40 mm temporally from the corneal vertex. The average absolute stromal thickness progression from the thinnest point could be described by the quadratic equation: stromal thickness = 6.411 x radius(2) + 2.444 x radius (R(2) = 0.999). Absolute stromal thickness progression was independent of stromal thickness at the thinnest point. The increase in hemi-meridional absolute stromal thickness progression was greatest superiorly and lowest temporally.
Conclusions: Three-dimensional thickness mapping of the corneal stroma and stromal thickness progression in a population of normal eyes represent a normative data set, which may help in early diagnosis of corneal abnormalities such as keratoconus and pellucid marginal degeneration. Absolute stromal thickness progression was found to be independent of stromal thickness.
Copyright 2009, SLACK Incorporated.
Figures


Comment in
-
Percentage thickness increase and absolute difference from thinnest to describe thickness profile.J Refract Surg. 2010 Feb;26(2):84-6; author reply 86-7. doi: 10.3928/1081597X-20100121-01. J Refract Surg. 2010. PMID: 20163071 No abstract available.
Similar articles
-
Epithelial, stromal, and total corneal thickness in keratoconus: three-dimensional display with artemis very-high frequency digital ultrasound.J Refract Surg. 2010 Apr;26(4):259-71. doi: 10.3928/1081597X-20100218-01. Epub 2010 Apr 7. J Refract Surg. 2010. PMID: 20415322 Free PMC article.
-
Epithelial thickness after hyperopic LASIK: three-dimensional display with Artemis very high-frequency digital ultrasound.J Refract Surg. 2010 Aug;26(8):555-64. doi: 10.3928/1081597X-20091105-02. J Refract Surg. 2010. PMID: 19928697 Free PMC article.
-
Repeatability of layered corneal pachymetry with the artemis very high-frequency digital ultrasound arc-scanner.J Refract Surg. 2010 Sep;26(9):646-59. doi: 10.3928/1081597X-20091105-01. Epub 2009 Nov 16. J Refract Surg. 2010. PMID: 19928698 Free PMC article.
-
Lenticule thickness readout for small incision lenticule extraction compared to artemis three-dimensional very high-frequency digital ultrasound stromal measurements.J Refract Surg. 2014 May;30(5):304-9. doi: 10.3928/1081597X-20140416-01. J Refract Surg. 2014. PMID: 24893355
-
LASIK flap thickness profile and reproducibility of the standard vs zero compression Hansatome microkeratomes: three-dimensional display with Artemis VHF digital ultrasound.J Refract Surg. 2011 Jun;27(6):417-26. doi: 10.3928/1081597X-20101110-01. Epub 2010 Nov 15. J Refract Surg. 2011. PMID: 21410084
Cited by
-
Understanding Corneal Epithelial Thickness Mapping.Middle East Afr J Ophthalmol. 2023 May 25;29(3):147-155. doi: 10.4103/meajo.meajo_207_22. eCollection 2022 Jul-Sep. Middle East Afr J Ophthalmol. 2023. PMID: 37408717 Free PMC article. Review.
-
Cornea and anterior eye assessment with slit lamp biomicroscopy, specular microscopy, confocal microscopy, and ultrasound biomicroscopy.Indian J Ophthalmol. 2018 Feb;66(2):195-201. doi: 10.4103/ijo.IJO_649_17. Indian J Ophthalmol. 2018. PMID: 29380757 Free PMC article. Review.
-
Multi-layered silk film coculture system for human corneal epithelial and stromal stem cells.J Tissue Eng Regen Med. 2018 Jan;12(1):285-295. doi: 10.1002/term.2499. Epub 2017 Sep 28. J Tissue Eng Regen Med. 2018. PMID: 28600807 Free PMC article.
-
Corneal epithelial thickness mapping.Indian J Ophthalmol. 2024 Feb 1;72(2):155-156. doi: 10.4103/IJO.IJO_21_24. Epub 2024 Jan 25. Indian J Ophthalmol. 2024. PMID: 38273680 Free PMC article. No abstract available.
-
The frequency of non-pathologically thin corneas in young healthy adults.Clin Ophthalmol. 2019 Jul 9;13:1123-1135. doi: 10.2147/OPTH.S188935. eCollection 2019. Clin Ophthalmol. 2019. PMID: 31371912 Free PMC article.
References
-
- Patel S, McLaren J, Hodge D, Bourne W. Normal human keratocyte density and corneal thickness measurement by using confocal microscopy in vivo. Invest Ophthalmol Vis Sci. 2001;42:333–339. - PubMed
-
- Patel SV, McLaren JW, Hodge DO, Bourne WM. Confocal microscopy in vivo in corneas of long-term contact lens wearers. Invest Ophthalmol Vis Sci. 2002;43:995–1003. - PubMed
-
- Erie JC, Patel SV, McLaren JW, Ramirez M, Hodge DO, Maguire LJ, Bourne WM. Effect of myopic laser in situ keratomileusis on epithelial and stromal thickness: a confocal microscopy study. Ophthalmology. 2002;109:1447–1452. - PubMed
-
- Reinstein DZ, Archer T. Combined Artemis very high-frequency digital ultrasound-assisted transepithelial phototherapeutic keratectomy and wavefront-guided treatment following multiple corneal refractive procedures. J Cataract Refract Surg. 2006;32:1870–1876. - PubMed
-
- Reinstein DZ, Srivannaboon S, Archer TJ, Silverman RH, Sutton H, Coleman DJ. Probability model of the inaccuracy of residual stromal thickness prediction to reduce the risk of ectasia after LASIK part I: quantifying individual risk. J Refract Surg. 2006;22:851–860. - PubMed
Publication types
MeSH terms
Grants and funding
LinkOut - more resources
Full Text Sources
Medical