

Review
doi: 10.1021/cr900223a.
In situ imaging of metals in cells and tissues
Affiliations
- PMID: 19772288
- PMCID: PMC3812694
- DOI: 10.1021/cr900223a
Item in Clipboard
Review
In situ imaging of metals in cells and tissues
Chem Rev.
2009 Oct.
No abstract available
Figures

Two-photon excitation microscopy (TPM) images of a rat hippocampal slice stained with 10 µM AZn2 (14). a) At a depth of ca. 120 µm with magnification 10x. Scale bar: 300 µm. b,c) Magnification at 100x in the stratum lucidum (SL) of CA3 regions (yellow box in (a)) at a depth of ca. 100 µm before (b) and after (c) addition of 200 µM TPEN to the imaging solution. Scale bar: 150 µm. d–f) TPM images in the hilus (H) of dentate gyrus (DG) regions at a depth of ca. 100 µm before (d) and after (e) addition of 50 mM KCl to the buffer solution. Scale bar: 300 µm. f) After addition of 200 µM TPEN to (e). The TPEF images were collected at 500–620 nm with excitation at 780 nm using a femtosecond pulsed laser. Reprinted with permission from reference . Copyright 2008 Wiley.

Principle of autometallographic silver enhancement (AMG). Electrons released from the reductant (hexagonal molecules) populate the valence band of the nanocrystal, thus increasing the probability for reducing silver ions that subsequently are integrated into the nanocrystal. As long as the AMG development proceeds the nanocrystal will grow in size, i.e. be silver-enhanced (hexagon molecules: reducing agent, gold: nanocrystals, blue: silver ions, grey: silver atoms). Reprinted with permission from reference . Copyright 2006 Elsevier.

Histochemically reactive Zn(II) in zinc-enriched neurons (ZEN) in a rat brain slice: (a) Micrograph of a 30-μm-thick sagittal cryostat section of rat brain from an animal treated with sodium selenite and allowed to survive 1.5 h before being sacrificed by a transcardial perfusion with glutaraldehyde, detected with AMG and toluidine blue. The framed areas are magnified in (b) and (c), bar = 5 mm. (b) ZEN terminals in the telencephalon, all believed to be glutaminergic, are highly ordered. The different shades from yellow to black are caused by the sizes and amounts of ZnSeAMG grains in the ZEN terminals. Small terminals with only one or two ZEN vesicles stain yellow, while huge ZEN boutons with many zinc-enriched synaptic vesicles stain black primarily because nearby AMG grains flow together, causing an increased absorption of light. Abbreviations: fd, fascia dentata; sub, subiculum. Bar = 300 μm. (c) The cochlear nucleus stains well; note also the yellow AMG staining of the molecular layer of spinocerebellum. Abbreviations: ml, molecular layer of spinocerebellum; gl, granular layer; cn, cochlear nucleus; pc, choroid plexus. Bar = 300 μm. Reprinted with permission from ref . Copyright 2005 Histochemical Society.

65Zn imaging of brain tissue sections implanted with C6 glioma cells. 65ZnCl2 was intravenously injected into rats 14 days after injection of vehicle (control) or C6 glioma cells into the hippocampus (n = 4). Autoradiography was performed on selected coronal slices 1 h and 6 days after injection of 65ZnCl2. Each experiment was performed four times and the autoradiograms obtained were almost identical. The schemes (left hand side) show maps of the rat brain. LV, lateral ventricle; 3V, 3rd ventricle; 4V, 4th ventricle; HIP, hippocampus. Reprinted with permission from reference . Copyright 2003 Elsevier.

Positron emission tomography (PET) using 45Ti as tracer nuclide. Two coronal microPET image slices (A and C) and one transaxial slice (B) of female BALB/c mouse bearing EMT-6 tumors (denoted by arrows) in both legs (right-hand side: 1 large tumor; left-hand side: 2 small tumors) injected with 27.72 MBq (750 µCi) 45Ti-transferrin, 1 h 40 min after injection. Reprinted with permission from reference . Copyright 2005 Society for Nuclear Medicine.

Schematic illustrating the switching mechanism of the Ca(II)-responsive MRI probe DOPTA-Gd (15). Binding of Ca(II) to the DOPTA ligand induces a conformational change, which in turn increases the relaxivity of water due to the additionally available coordination sites at the Gd(III) centers.

Schematic diagram illustrating the components of an X-ray fluorescence microscope. A crystal monochromator is used to select the energy of the incident X-ray beam, which is focused with a Fresnel zone plate on the specimen. The emitted X-rays are collected with an energy dispersive detector, thus allowing for simultaneous multi-element analysis. Raster-scanning across the specimen area yields then quantitative elemental maps, as illustrated on the computer monitor. The purpose of the transmission detector is to help orient the sample on the scanning stage. Reprinted with permission from reference . Copyright Elsevier 2007.

MicroXRF imaging of mouse fbroblast cells grown on 200 mesh EM gold grids coated with a formvar-carbon thin film. (A) DIC image of in-air dried cell. (B) Raster scanned microXRF topographical maps for selected elements (excitation at 10 keV, pixel size 0.3 µm, integration time 1 sec/pixel). Reprinted with permission from reference . Copyright Elsevier 2006.

SXRF elemental imaging of neurites with submicron resolution. Left: optical image of PC12 cells after cryofixation and freeze drying. Cells were cultured with 300 µM iron during 24 h and treated with NGF. The black squares show the areas analyzed by synchrotron nanoprobe X-ray fluorescence. White arrows show the thin neurite-like processes. Right: X-ray fluorescence images of chemical elements in the cell body (A), main ramification (B) and in thin neurite-like processes (A, B, C, D). The color scale bar indicates intensity of X-rays which increases from blue to red.

Histochemical and SXRF analysis of atherosclerotic plaques. Consecutive sections of aortic root of apoE/LDLR/ mouse stained with oil red-O (a), Masson’s trichrome (b) and double-immunostained for smooth muscle actin (red) and CD68 (green) (c). General distributions of calcium (d), chlorine (e), copper (f), iron (g), potassium (h), phosphorus (i), sulphur (j) and zinc (k) obtained by micro-XRF in adjacent section (d–k). Atherosclerotic plaques are labeled with oil red-O (a), smooth muscle cells are present in media (c, arrowheads) and in intima (c, arrow). Notice high accumulation of Fe, S, Zn in intimal smooth muscle (arrows in g, j, k). Collagen fibers are stained green in Masson’s trichrome (b). Blood clot (asterisk) present in the aortic lumen shows very high concentration of iron (g). Scale bars = 500 µm. Gray-scale intensity bars show numbers of counts.

Optical micrograph (top left) and x-ray fluorescence (XRF) elemental distribution images of a 100-µm-thick section of an unrestored carious human tooth. Three-color overlay (top left; linear scale: Ca red, Cu green, Zn blue) and individual XRF elemental distribution images of a representative area (shown as a red square) of the carious front of the section. Maximum concentrations, in microgram per gram, are shown below the elemental symbol for the XRF images. Reprinted with permission from reference . Copyright 2008 Springer Berlin.

High resolution elemental distributions of zebrafish head. Head section from zebrafish larvae treated with 100 µM MeHg-L-cysteine for 24 h. (A) histological image, (B) mercury distribution using x-ray fluorescence imaging at 2.5 µm resolution, and (C) Hg (green) superimposed on S (red) and Zn (blue). Quantities of the different elements are plotted on arbitrary scales. Reprinted with permission of reference . Copyright 2008 National Academy of Sciences.

SIMS maps of fibroblast cells dosed with 50 ppm of dissolved Cr(III) and incubated for 7 h: (a) positive SIMS maps, blue: Ca+, red: Cr+; (b) negative SIMS maps, red: CN, blue: PO2. Scale bar = 50 µm. Reprinted with permission from reference . Copyright 2006 Elsevier.

Distribution of Zn, Cu and Pb in the hippocampus region measured by LA-ICP-MS. In a light photomicrograph (left) of an adjacent section stained by cresyl violet cortical regions are labeled: (FC: fascia dentata circumscribed by a densely dotted line; CA1–4: cornu ammonis, part 1–4 circumscribed by loosely dotted lines, respectively; asterisks: stratum lucidum of CA3). Borders between these areas were determined by optical inspection. The dashed box open to the left indicates the overlap of the LA-ICP-MS images with this photomicrograph. Reprinted with permission from reference . Copyright 2008 Elsevier.
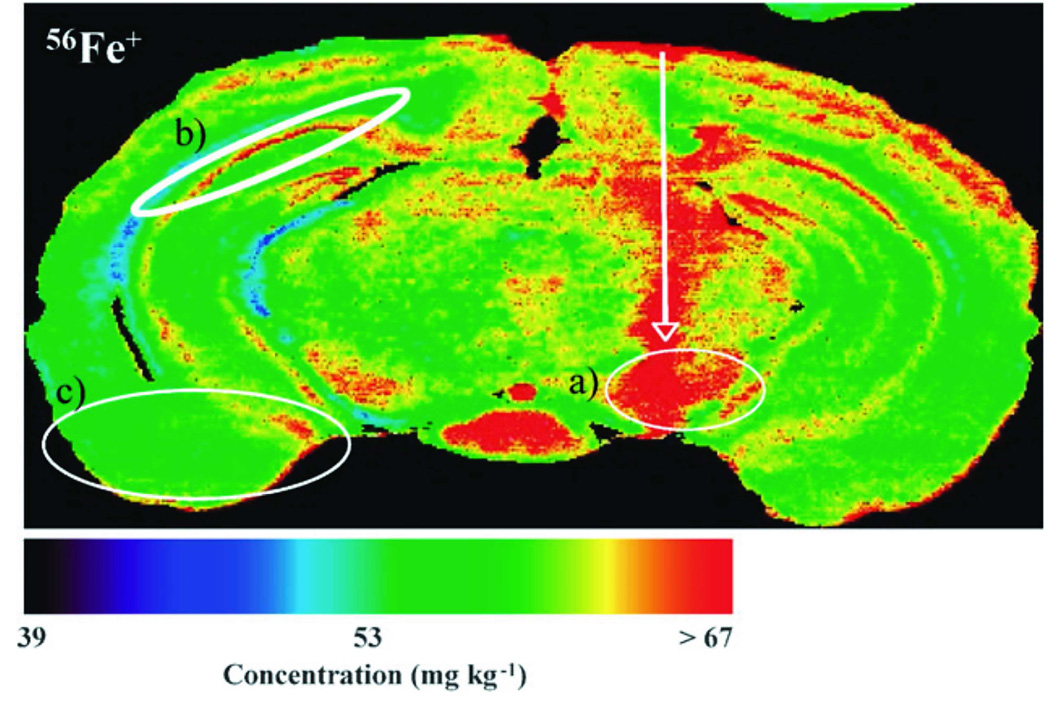
Quantitative 56Fe imaging of 6-OHDA lesioned mouse brain at the level of the SN using LA-ICP-MS. The needle track is shown by the white arrow. (a) = substantia nigra, (b) = dentate gyrus, (c) = amygdala and hippocampus. Reprinted with permission from reference . Copyright 2009 Royal Society of Chemistry.

Sentinel lymph node partly replaced by metastatic melanoma (upper two thirds of the ovoid-shaped lymph node). (a) Photograph of slice before elemental imaging, (b) H&E stain, (c) 31P+ image without 13C normalization, (d) 31P+ image, (e) 31P+/34S+ and (f) 31P+/66Zn+. Reprinted with permission from reference . Copyright 2009 Royal Society of Chemistry.


References
-
- Li YF, Chen CY, Qu Y, Gao YX, Li B, Zhao YL, Chai ZF. Pure Appl. Chem. 2008;80:2577.
-
- Ascone I, Strange R. J. Synchrot. Radiat. 2009;16:413. - PubMed
-
- Finney LA, O’Halloran TV. Science. 2003;300:931. - PubMed
-
- Bush AI. Curr. Opin. Chem. Biol. 2000;4:184. - PubMed
-
- Perls M. Virchows Arch. Pathol. Anat. 1867;39:42.
Publication types
MeSH terms
Substances
Grants and funding
LinkOut - more resources
Full Text Sources
Other Literature Sources
