. 2009 Sep 22:9:120.
doi: 10.1186/1471-2229-9-120.

Characterization of WRKY co-regulatory networks in rice and Arabidopsis

Affiliations

Characterization of WRKY co-regulatory networks in rice and Arabidopsis

Stefano Berri et al. BMC Plant Biol. .

Abstract

Background: The WRKY transcription factor gene family has a very ancient origin and has undergone extensive duplications in the plant kingdom. Several studies have pointed out their involvement in a range of biological processes, revealing that a large number of WRKY genes are transcriptionally regulated under conditions of biotic and/or abiotic stress. To investigate the existence of WRKY co-regulatory networks in plants, a whole gene family WRKYs expression study was carried out in rice (Oryza sativa). This analysis was extended to Arabidopsis thaliana taking advantage of an extensive repository of gene expression data.

Results: The presented results suggested that 24 members of the rice WRKY gene family (22% of the total) were differentially-regulated in response to at least one of the stress conditions tested. We defined the existence of nine OsWRKY gene clusters comprising both phylogenetically related and unrelated genes that were significantly co-expressed, suggesting that specific sets of WRKY genes might act in co-regulatory networks. This hypothesis was tested by Pearson Correlation Coefficient analysis of the Arabidopsis WRKY gene family in a large set of Affymetrix microarray experiments. AtWRKYs were found to belong to two main co-regulatory networks (COR-A, COR-B) and two smaller ones (COR-C and COR-D), all including genes belonging to distinct phylogenetic groups. The COR-A network contained several AtWRKY genes known to be involved mostly in response to pathogens, whose physical and/or genetic interaction was experimentally proven. We also showed that specific co-regulatory networks were conserved between the two model species by identifying Arabidopsis orthologs of the co-expressed OsWRKY genes.

Conclusion: In this work we identified sets of co-expressed WRKY genes in both rice and Arabidopsis that are functionally likely to cooperate in the same signal transduction pathways. We propose that, making use of data from co-regulatory networks, it is possible to highlight novel clusters of plant genes contributing to the same biological processes or signal transduction pathways. Our approach will contribute to unveil gene cooperation pathways not yet identified by classical genetic analyses. This information will open new routes contributing to the dissection of WRKY signal transduction pathways in plants.


Figures

Figure 1
Figure 1
Phylogenetic tree of rice OsWRKY whole gene family. Phylogenetic tree of rice WRKY proteins. The tree was obtained on the basis of WRKY domain sequences of the 104 rice WRKY protein sequences with the Maximum Likelihood method using PHYML [68]. Both the N and the C WRKY domains were considered for those proteins bearing two domains. Bootstrap values higher than 50 are indicated in the nodes. Letters indicate the nine clusters of co-expressed genes, as presented in Figure 2 and Figure 3. The tree image was produced using iTOL software [69].
Figure 2
Figure 2
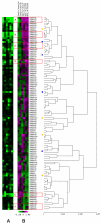
Clustering of OsWRKY genes according to their expression profiles in the OsWRKYARRAY. The OsWRKYARRAY was constitued of 104 probesets representing all members of the rice WRKY gene family. The expression of the 104 OsWRKY genes was assessed upon inoculation with Magnaporthe oryzae isolate from rice (FR13), M. oryzae BR32 from wheat, M. grisea BR29 from crabgrass and upon application of osmotic stress (mannitol) in hydroponic conditions. Panel A T-test P-values (shown by a green - black gradient) of treated vs control of the corresponding ratios shown in Panel B. The range of log transformed P-values comprised values between 0.01 (green) and 1 (black). P-values lower than 0.01 were visualized as 0.01. Panel B log2(Treated/Control) ratio values (shown by a green - magenta gradient). Red boxes with capital letters from A to F highlight the presence of co-expressed WRKY gene clusters. A blue dot indicates a OsWRKY gene differentially-regulated in two different stress conditions; a yellow dot indicates a OsWRKY gene-differentially regulated only in one stress condition. See Table 1 for numeric values of differentially-regulated OsWRKY genes.
Figure 3
Figure 3
Clustering of OsWRKY genes according to their expression profile in the NIAS 22 K array. Clustering of the 50 OsWRKY genes present in the NIAS 22 K array according to their expression profiles in 30 experiments (upon abiotic stress conditions and in different plant tissues) was performed. Panel A T-test P-values (shown by a green - black gradient) of treated vs control of the corresponding ratios shown in Panel B. The range of log transformed P-values comprised values between 0.01 (green) and 1 (black). P-values lower than 0.01 were visualized as 0.01. Panel B log2(Treated/Control) ratio values (shown by a green - magenta gradient). Red boxes with capital letters from G to I highlight the presence of co-expressed WRKY gene clusters.
Figure 4
Figure 4
Co-regulatory networks of Arabidopsis WRKY genes. For each pair of WRKY genes, the Pearson Coefficient was calculated on untransformed values P-lin (see Panel A) and on log-transformed values P-log (see Panel B) to measure the correlation of expression levels, based on 2,000 Arabidopsis microarray experiments. Each pair of correlated WRKY genes (Pearson Correlation Coefficient value higher than 0.6) are shown in the figure with an edge connecting them. The thickness of the edges is proportional to the value of the Pearson Correlation Coefficient. Thick black line: Pearson Correlation Coefficient 0.96; Thin black line: Pearson Correlation Coefficient 0.6. Proximity of two genes on the graph is not indicative of their relatedness. The colours indicate different phylogenetic groups. See Additional files 5 and 6 for the specific numeric values of the P-lin and P-log correlation coefficient, respectively. The four identified co-regulatory neworks were indicated as: COR-A, COR-B, COR-C and COR-D.

References

    1. Willmott RL, Rushton PJ, Hooley R, Lazarus CM. DNase1 footprints suggest the involvement of at least three types of transcription factors in the regulation of alpha-Amy2/A by gibberellin. Plant Mol Biol. 1998;38:817–825. doi: 10.1023/A:1006084104041. - DOI - PubMed
    1. Yu D, Chen C, Chen Z. Evidence for an important role of WRKY DNA binding proteins in the regulation of NPR1 gene expression. Plant Cell. 2001;13:1527–1540. doi: 10.1105/tpc.13.7.1527. - DOI - PMC - PubMed
    1. Dong J, Chen C, Chen Z. Expression profiles of the Arabidopsis WRKY gene superfamily during plant defense response. Plant Mol Biol. 2003;51:21–37. doi: 10.1023/A:1020780022549. - DOI - PubMed
    1. Miao Y, Laun T, Zimmermann P, Zentgraf U. Targets of the WRKY53 transcription factor and its role during leaf senescence in Arabidopsis. Plant Mol Biol. 2004;55:853–867. - PubMed
    1. Eulgem T, Rushton P, Schmelzer E, Hahlbrock K, Somssich I. Early nuclear events in plant defence signalling: rapid gene activation by WRKY transcription factors. EMBO J. 1999;18:4689–4699. doi: 10.1093/emboj/18.17.4689. - DOI - PMC - PubMed

Publication types