

Wideband acoustic-reflex test in a test battery to predict middle-ear dysfunction
- PMID: 19772907
- PMCID: PMC3694582
- DOI: 10.1016/j.heares.2009.09.008
Wideband acoustic-reflex test in a test battery to predict middle-ear dysfunction
Abstract
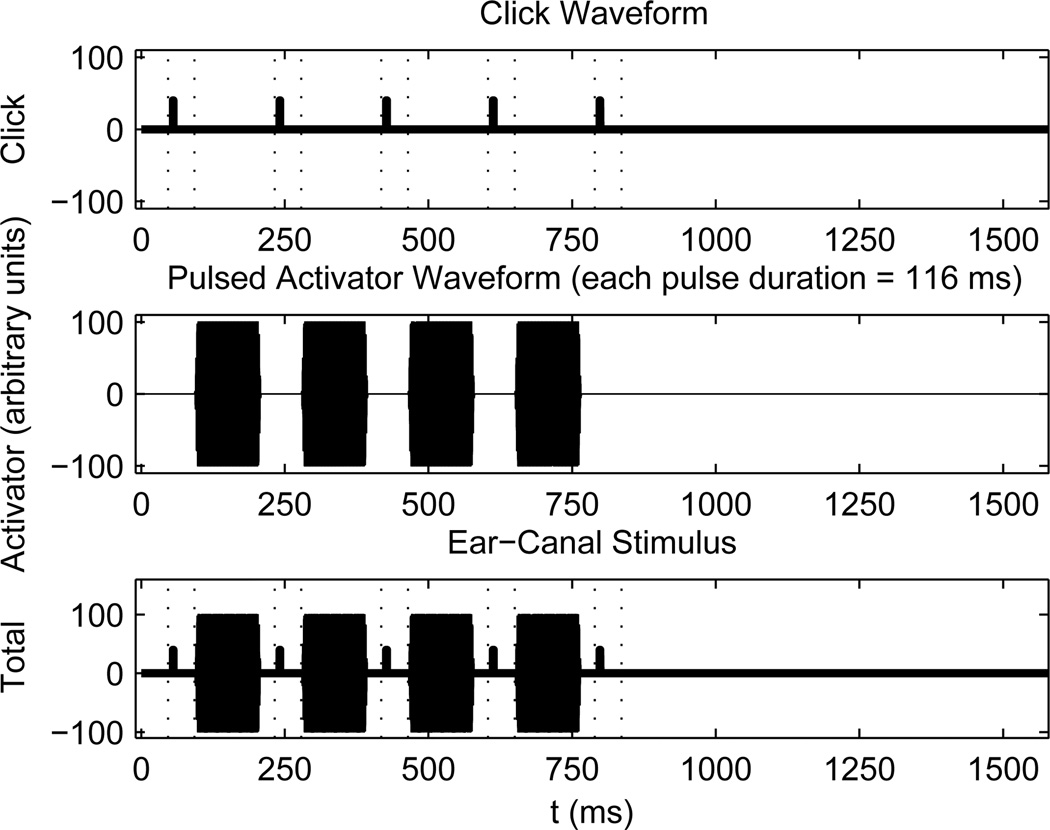
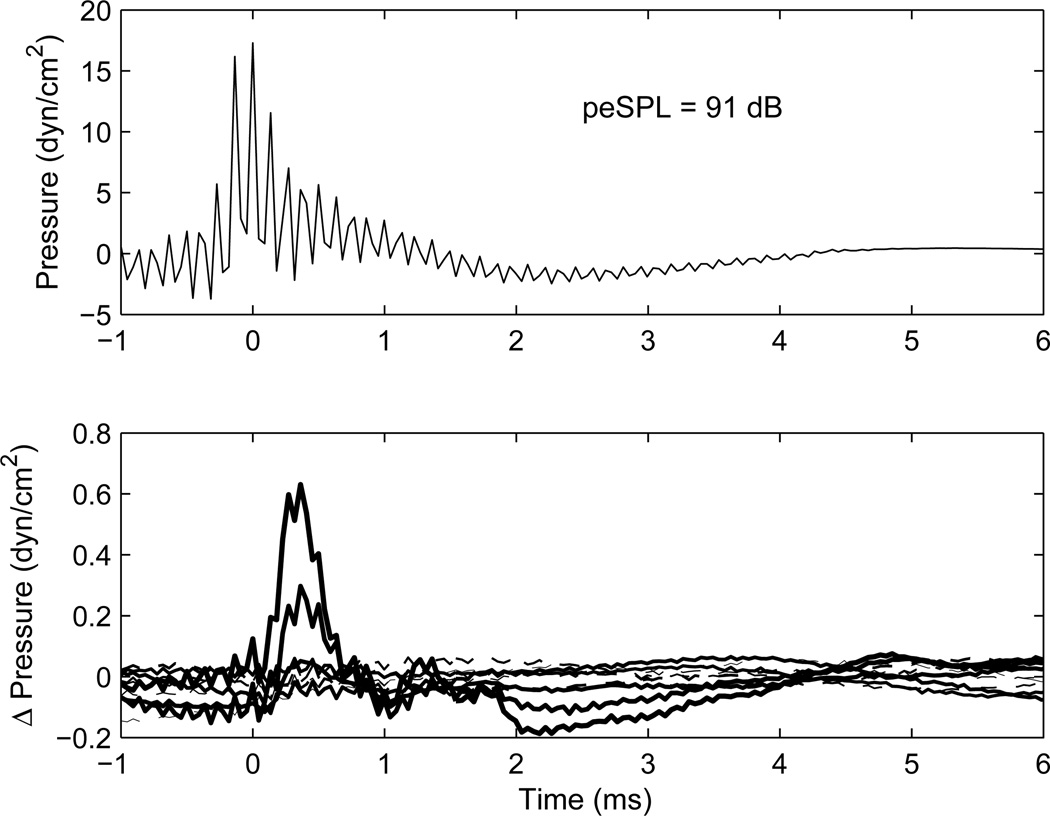
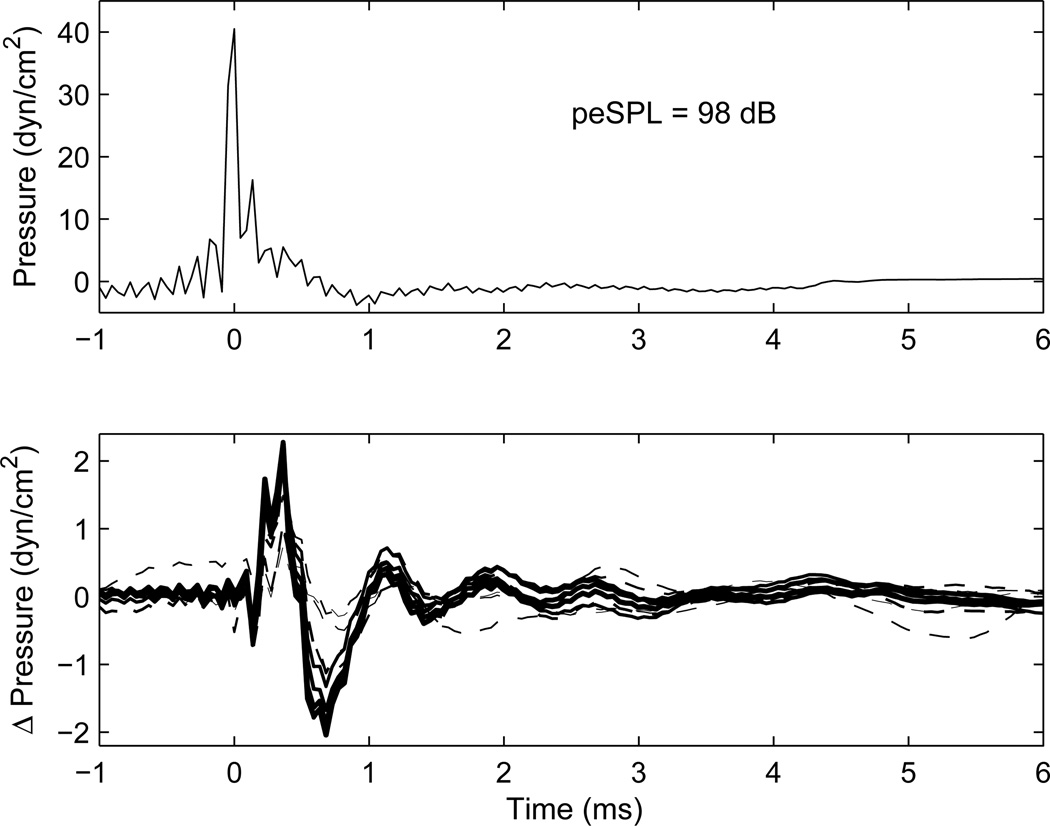
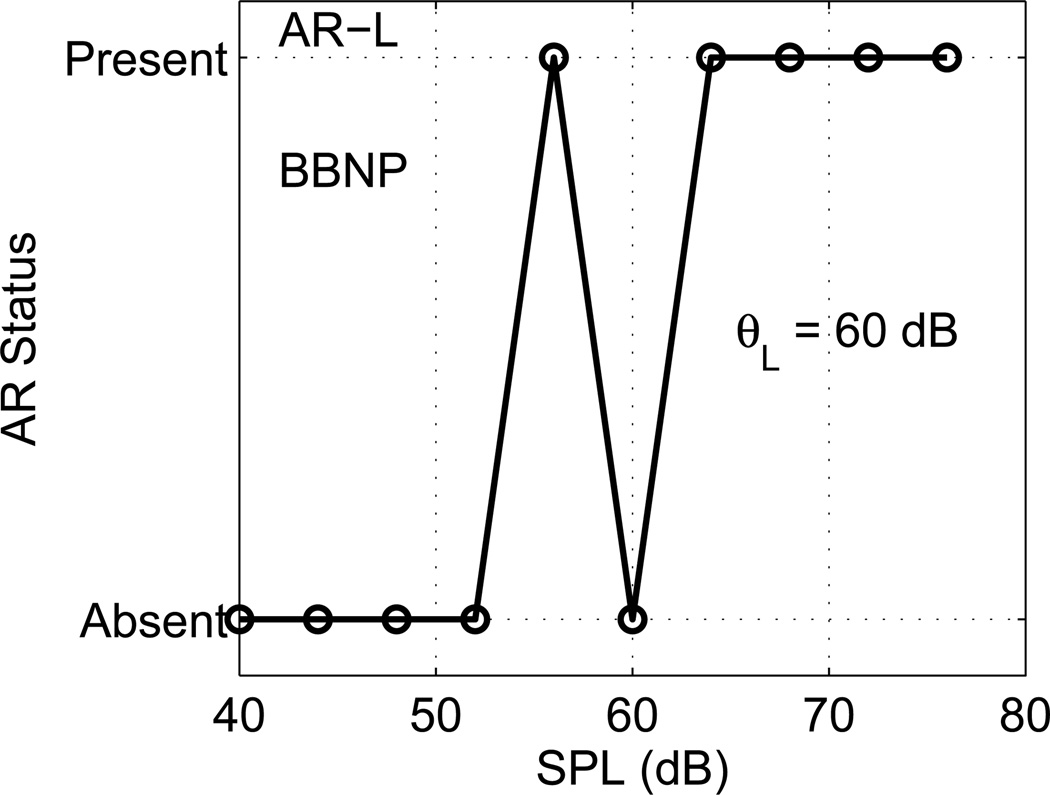
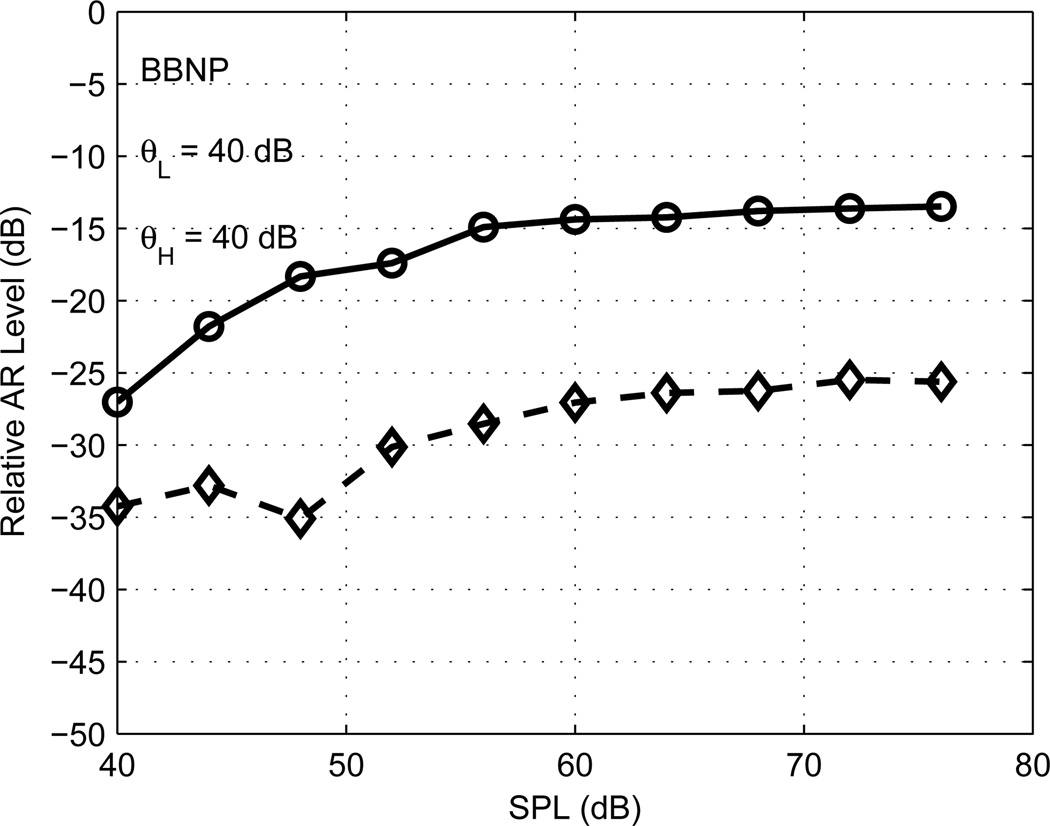
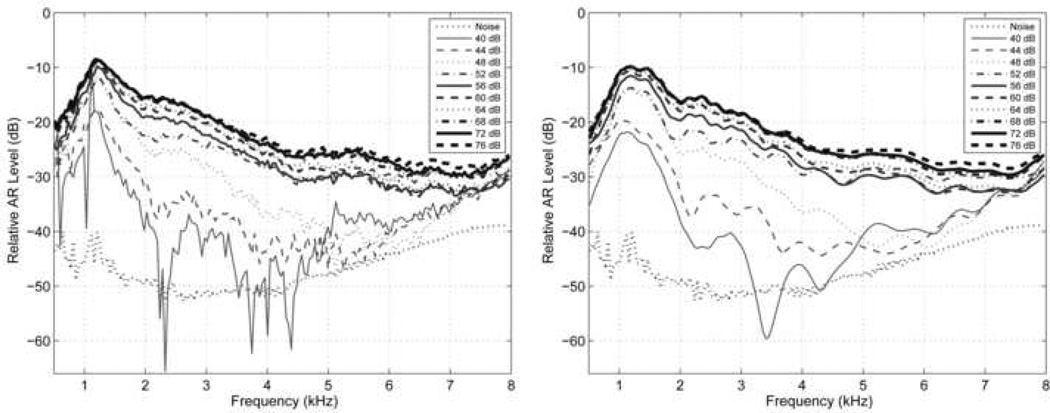
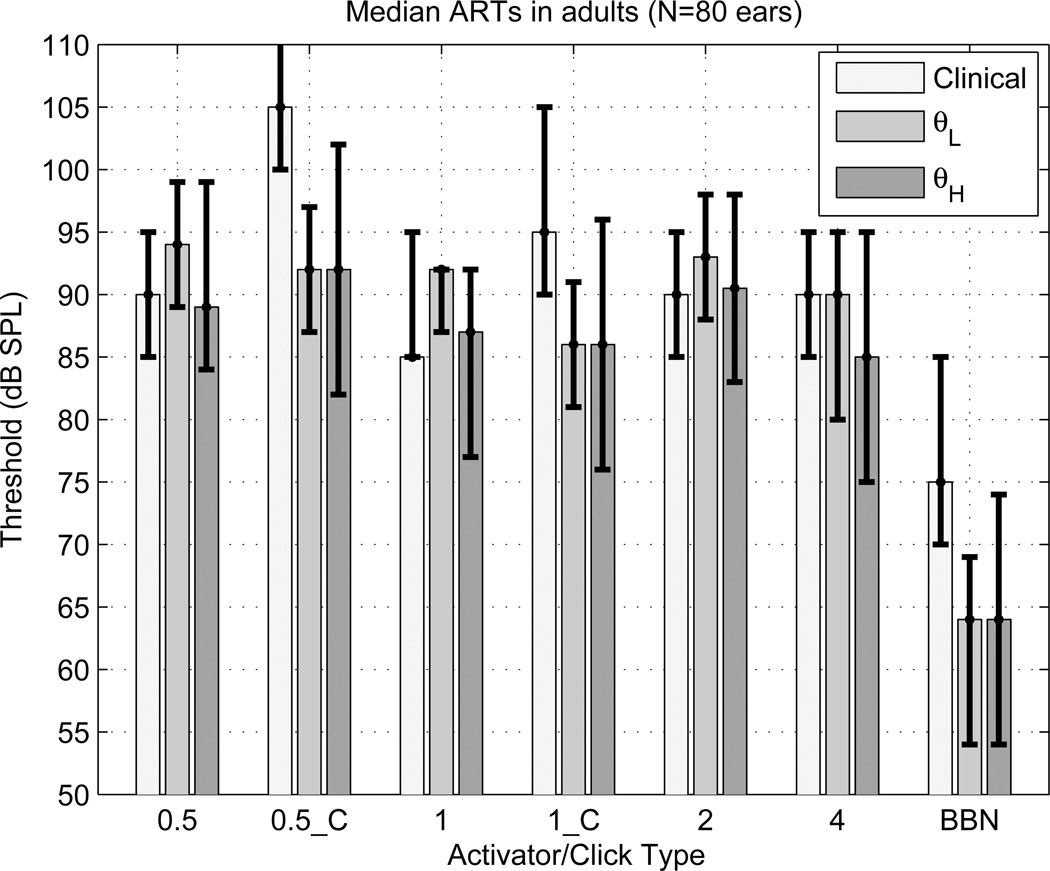
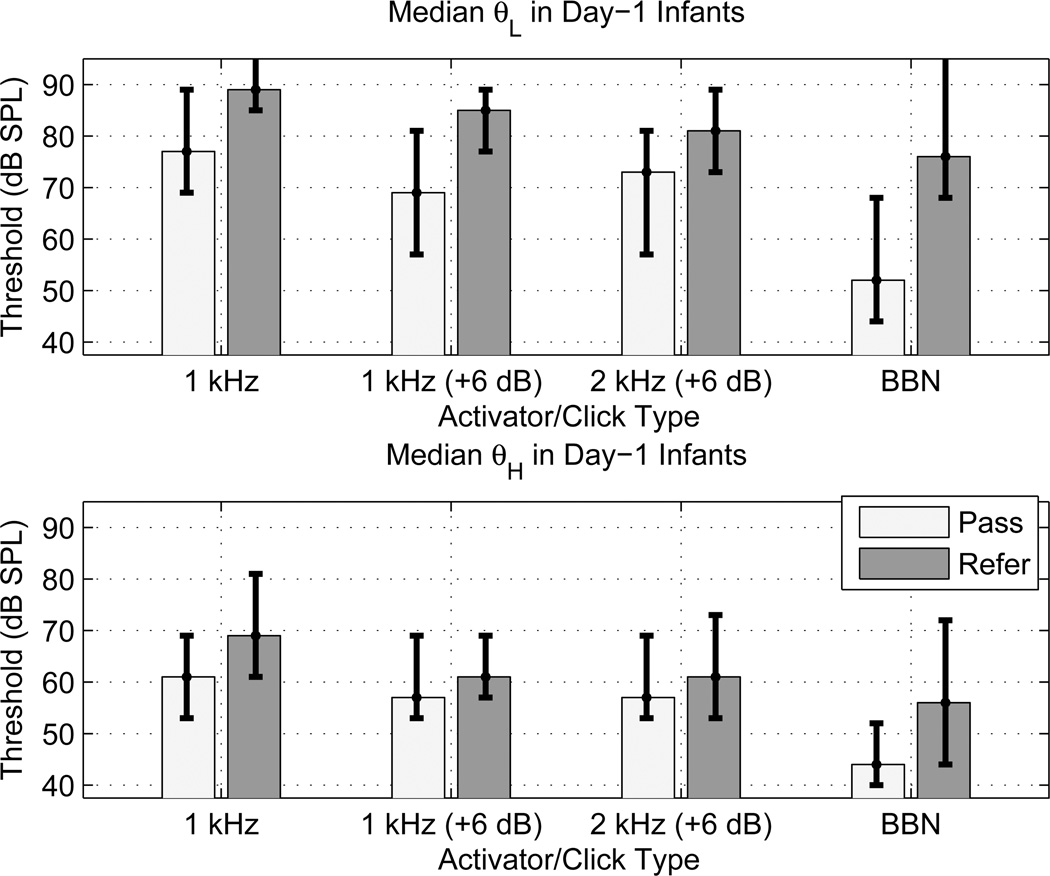
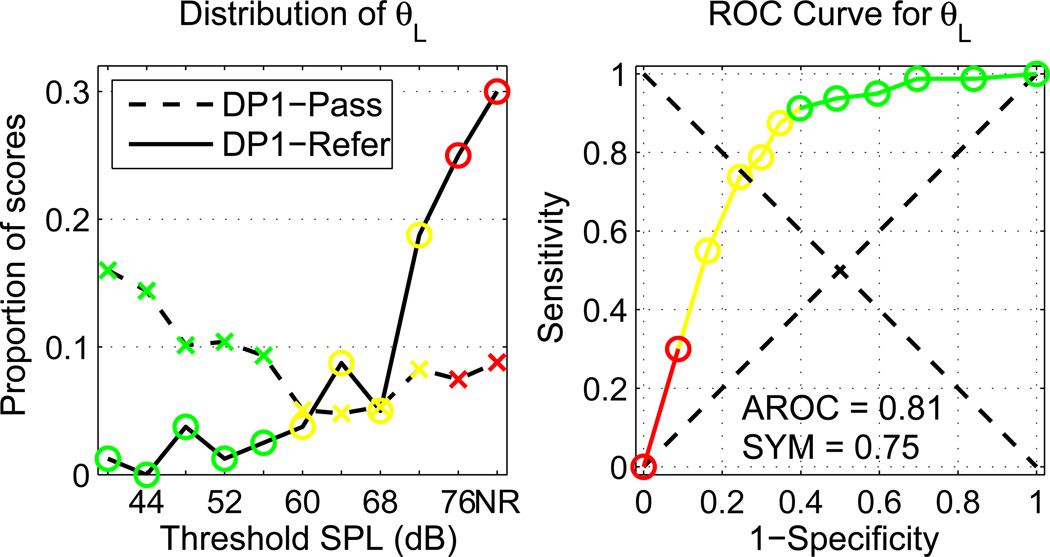
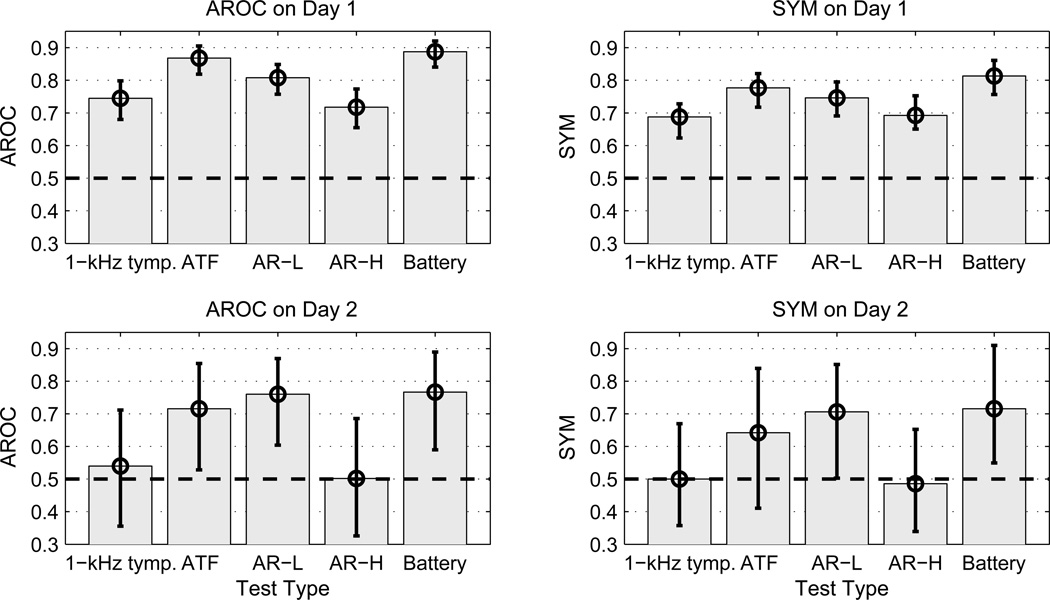
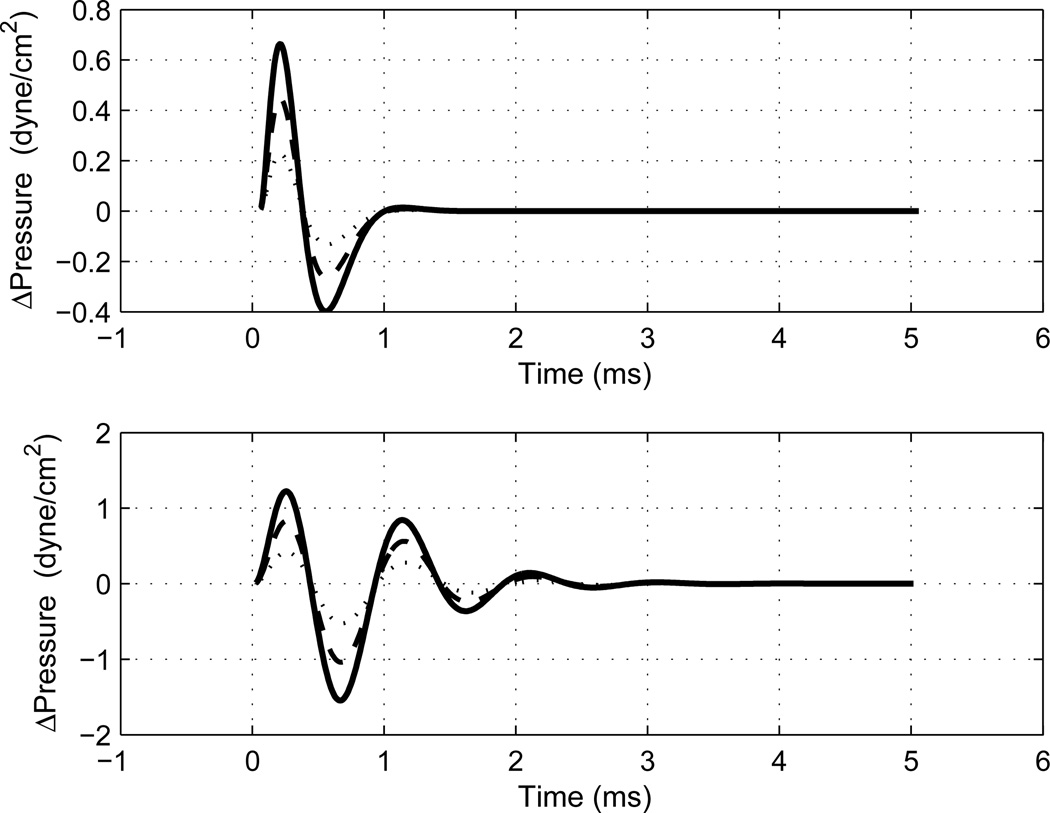
A wideband (WB) aural acoustical test battery of middle-ear status, including acoustic-reflex thresholds (ARTs) and acoustic-transfer functions (ATFs, i.e., absorbance and admittance) was hypothesized to be more accurate than 1-kHz tympanometry in classifying ears that pass or refer on a newborn hearing screening (NHS) protocol based on otoacoustic emissions. Assessment of middle-ear status may improve NHS programs by identifying conductive dysfunction and cases in which auditory neuropathy exists. Ipsilateral ARTs were assessed with a stimulus including four broadband-noise or tonal activator pulses alternating with five clicks presented before, between and after the pulses. The reflex shift was defined as the difference between final and initial click responses. ARTs were measured using maximum likelihood both at low frequencies (0.8-2.8 kHz) and high (2.8-8 kHz). The median low-frequency ART was elevated by 24 dB in NHS refers compared to passes. An optimal combination of ATF and ART tests performed better than either test alone in predicting NHS outcomes, and WB tests performed better than 1-kHz tympanometry. Medial olivocochlear efferent shifts in cochlear function may influence ARs, but their presence would also be consistent with normal conductive function. Baseline clinical and WB ARTs were also compared in ipsilateral and contralateral measurements in adults.
Copyright (c) 2009 Elsevier B.V. All rights reserved.
Figures
Similar articles
-
Identifying Otosclerosis with Aural Acoustical Tests of Absorbance, Group Delay, Acoustic Reflex Threshold, and Otoacoustic Emissions.J Am Acad Audiol. 2017 Oct;28(9):838-860. doi: 10.3766/jaaa.16172. J Am Acad Audiol. 2017. PMID: 28972472 Free PMC article.
-
Audiometric predictions using stimulus-frequency otoacoustic emissions and middle ear measurements.Ear Hear. 2005 Oct;26(5):487-503. doi: 10.1097/01.aud.0000179692.81851.3b. Ear Hear. 2005. PMID: 16230898 Free PMC article.
-
Automated Adaptive Wideband Acoustic Reflex Threshold Estimation in Normal-hearing Adults.Ear Hear. 2022 Mar/Apr;43(2):370-378. doi: 10.1097/AUD.0000000000001102. Ear Hear. 2022. PMID: 34320528 Free PMC article.
-
[Functional examinations of the ear and auditory pathway].Duodecim. 2011;127(8):826-34. Duodecim. 2011. PMID: 21568109 Review. Finnish.
-
Acoustic reflex measurement.Ear Hear. 2013 Jul;34 Suppl 1:43S-47S. doi: 10.1097/AUD.0b013e31829c70d9. Ear Hear. 2013. PMID: 23900179 Review.
Cited by
-
Contralateral Noise Stimulation Delays P300 Latency in School-Aged Children.PLoS One. 2016 Feb 5;11(2):e0148360. doi: 10.1371/journal.pone.0148360. eCollection 2016. PLoS One. 2016. PMID: 26849224 Free PMC article.
-
Normative Wideband Reflectance, Equivalent Admittance at the Tympanic Membrane, and Acoustic Stapedius Reflex Threshold in Adults.Ear Hear. 2017 May/Jun;38(3):e142-e160. doi: 10.1097/AUD.0000000000000399. Ear Hear. 2017. PMID: 28045835 Free PMC article.
-
Controlled exploration of the effects of conductive hearing loss on wideband acoustic immittance in human cadaveric preparations.Hear Res. 2016 Nov;341:19-30. doi: 10.1016/j.heares.2016.07.018. Epub 2016 Aug 3. Hear Res. 2016. PMID: 27496538 Free PMC article.
-
Reliability and interrelations of seven proxy measures of cochlear synaptopathy.Hear Res. 2019 Apr;375:34-43. doi: 10.1016/j.heares.2019.01.018. Epub 2019 Jan 23. Hear Res. 2019. PMID: 30765219 Free PMC article.
-
Maturation of the human medial efferent reflex revisited.J Acoust Soc Am. 2013 Feb;133(2):938-50. doi: 10.1121/1.4773265. J Acoust Soc Am. 2013. PMID: 23363111 Free PMC article.
References
-
- Abdala C, Keefe DH. Effects of middle-ear immaturity on distortion-product otoacoustic emission suppression tuning in infant ears. J. Acoust. Soc. Am. 2006;120:3832–3842. - PubMed
-
- Bennett MJ, Weatherby LA. Newborn acoustic reflexes to noise and pure-tone signals. J. Speech Hear. Res. 1982;25:383–387. - PubMed
-
- Berlin CI, Hood LJ, Morlet T, Wilensky D, St. John P, Montgomery E, Thibodaux M. Absent or elevated middle ear muscle reflexes in the presence of normal otoacoustic emissions: a universal finding in 136 cases of auditory neuropathy/dys- synchrony. J. Am. Acad. Audiol. 2005;16:546–53. - PubMed
-
- Feeney M, Keefe DH. Acoustic reflex detection using wide-band acoustic reflectance, admittance, and power. J. Speech Lang. Hear. Res. 1999;42:1029–1041. - PubMed
Publication types
MeSH terms
Grants and funding
LinkOut - more resources
Full Text Sources
Medical
Miscellaneous
