

The nuclear periphery of embryonic stem cells is a transcriptionally permissive and repressive compartment
- PMID: 19773359
- PMCID: PMC2758804
- DOI: 10.1242/jcs.052555
The nuclear periphery of embryonic stem cells is a transcriptionally permissive and repressive compartment
Abstract
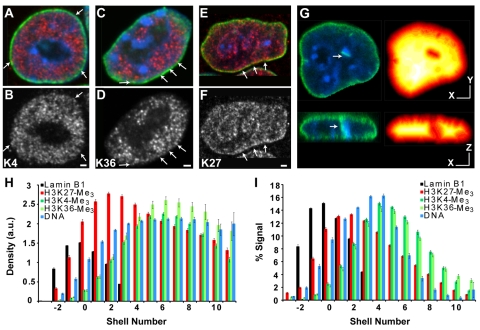
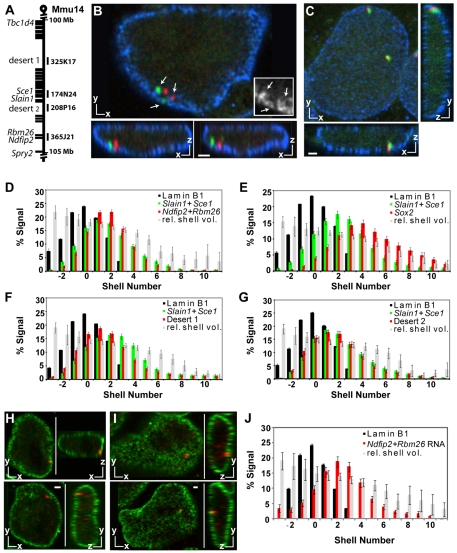
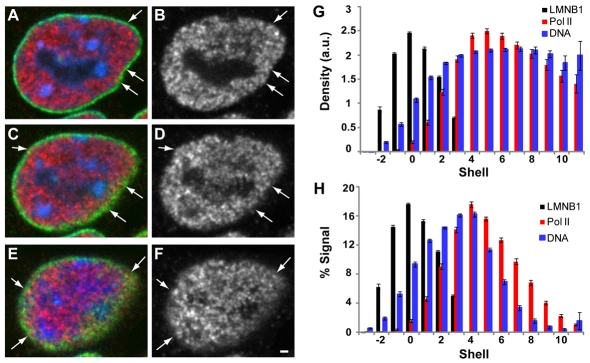
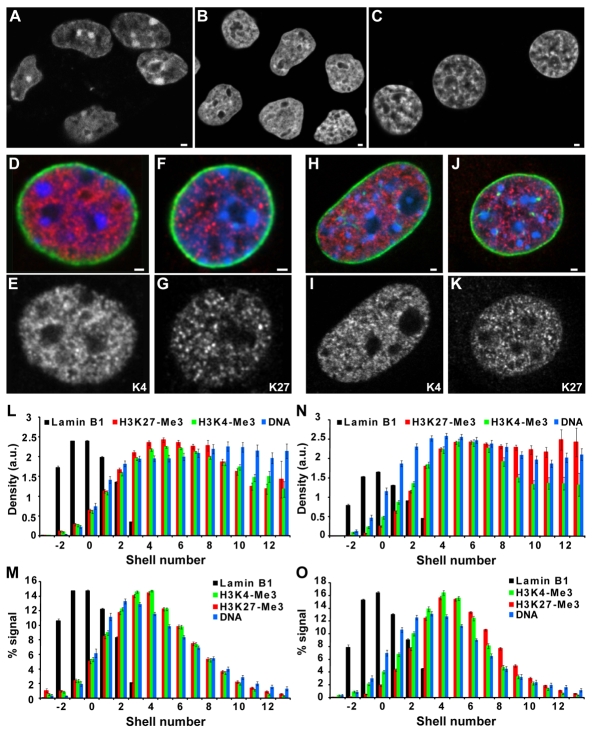
Chromatin adapts a distinct structure and epigenetic state in embryonic stem cells (ESCs), but how chromatin is three-dimensionally organized within the ESC nucleus is poorly understood. Because nuclear location can influence gene expression, we examined the nuclear distributions of chromatin with key epigenetic marks in ESC nuclei. We focused on chromatin at the nuclear periphery, a compartment that represses some but not all associated genes and accumulates facultative heterochromatin in differentiated cells. Using a quantitative, cytological approach, we measured the nuclear distributions of genes in undifferentiated mouse ESCs according to epigenetic state and transcriptional activity. We found that trimethyl histone H3 lysine 27 (H3K27-Me(3)), which marks repressed gene promoters, is enriched at the ESC nuclear periphery. In addition, this compartment contains 10-15% of chromatin with active epigenetic marks and hundreds of transcription sites. Surprisingly, comparisons with differentiated cell types revealed similar nuclear distributions of active chromatin. By contrast, H3K27-Me(3) was less concentrated at the nuclear peripheries of differentiated cells. These findings demonstrate that the nuclear periphery is an epigenetically dynamic compartment that might be distinctly marked in pluripotent ESCs. In addition, our data indicate that the nuclear peripheries of multiple cell types can contain a significant fraction of both active and repressed genes.
Figures
Similar articles
-
Neural induction promotes large-scale chromatin reorganisation of the Mash1 locus.J Cell Sci. 2006 Jan 1;119(Pt 1):132-40. doi: 10.1242/jcs.02727. J Cell Sci. 2006. PMID: 16371653
-
Epigenome and chromatin structure in human embryonic stem cells undergoing differentiation.Dev Dyn. 2008 Dec;237(12):3690-702. doi: 10.1002/dvdy.21773. Dev Dyn. 2008. PMID: 18985715
-
Chicken embryonic stem cells and primordial germ cells display different heterochromatic histone marks than their mammalian counterparts.Epigenetics Chromatin. 2016 Feb 10;9:5. doi: 10.1186/s13072-016-0056-6. eCollection 2016. Epigenetics Chromatin. 2016. PMID: 26865862 Free PMC article.
-
Differentiation and large scale spatial organization of the genome.Curr Opin Genet Dev. 2010 Oct;20(5):562-9. doi: 10.1016/j.gde.2010.05.009. Epub 2010 Jun 17. Curr Opin Genet Dev. 2010. PMID: 20561778 Review.
-
Concise review: epigenetic mechanisms contribute to pluripotency and cell lineage determination of embryonic stem cells.Stem Cells. 2007 Jan;25(1):2-9. doi: 10.1634/stemcells.2006-0383. Epub 2006 Oct 5. Stem Cells. 2007. PMID: 17023513 Review.
Cited by
-
Subcellular rearrangement of hsp90-binding immunophilins accompanies neuronal differentiation and neurite outgrowth.J Neurochem. 2010 Nov;115(3):716-34. doi: 10.1111/j.1471-4159.2010.06970.x. Epub 2010 Sep 28. J Neurochem. 2010. PMID: 20796173 Free PMC article.
-
Nuclear positioning and pairing of X-chromosome inactivation centers are not primary determinants during initiation of random X-inactivation.Nat Genet. 2019 Feb;51(2):285-295. doi: 10.1038/s41588-018-0305-7. Epub 2019 Jan 14. Nat Genet. 2019. PMID: 30643252 Free PMC article.
-
LINEs of evidence: noncanonical DNA replication as an epigenetic determinant.Biol Direct. 2013 Sep 13;8:22. doi: 10.1186/1745-6150-8-22. Biol Direct. 2013. PMID: 24034780 Free PMC article. Review.
-
Nuclear positioning, higher-order folding, and gene expression of Mmu15 sequences are refractory to chromosomal translocation.Chromosoma. 2011 Feb;120(1):61-71. doi: 10.1007/s00412-010-0290-9. Epub 2010 Aug 12. Chromosoma. 2011. PMID: 20703494 Free PMC article.
-
Organization of nuclear architecture during adipocyte differentiation.Nucleus. 2016 May 3;7(3):249-69. doi: 10.1080/19491034.2016.1197442. Nucleus. 2016. PMID: 27416359 Free PMC article. Review.
References
-
- Akhtar, A. and Gasser, S. M. (2007). The nuclear envelope and transcriptional control. Nat. Rev. Genet. 8, 507-517. - PubMed
-
- Andrulis, E. D., Neiman, A. M., Zappulla, D. C. and Sternglanz, R. (1998). Perinuclear localization of chromatin facilitates transcriptional silencing. Nature 394, 592-595. - PubMed
-
- Azuara, V., Perry, P., Sauer, S., Spivakov, M., Jorgensen, H. F., John, R. M., Gouti, M., Casanova, M., Warnes, G., Merkenschlager, M. et al. (2006). Chromatin signatures of pluripotent cell lines. Nat. Cell Biol. 8, 532-538. - PubMed
-
- Bartova, E., Pachernik, J., Harnicarova, A., Kovarik, A., Kovarikova, M., Hofmanova, J., Skalnikova, M., Kozubek, M. and Kozubek, S. (2005). Nuclear levels and patterns of histone H3 modification and HP1 proteins after inhibition of histone deacetylases. J. Cell Sci. 118, 5035-5046. - PubMed
-
- Bernstein, B. E., Mikkelsen, T. S., Xie, X., Kamal, M., Huebert, D. J., Cuff, J., Fry, B., Meissner, A., Wernig, M., Plath, K. et al. (2006). A bivalent chromatin structure marks key developmental genes in embryonic stem cells. Cell 125, 315-326. - PubMed
Publication types
MeSH terms
Substances
Grants and funding
LinkOut - more resources
Full Text Sources
Other Literature Sources
Molecular Biology Databases
