

Interaction of the multikinase inhibitors sorafenib and sunitinib with solute carriers and ATP-binding cassette transporters
- PMID: 19773380
- PMCID: PMC2774722
- DOI: 10.1158/1078-0432.CCR-09-0048
Interaction of the multikinase inhibitors sorafenib and sunitinib with solute carriers and ATP-binding cassette transporters
Abstract
Purpose: To compare side-by-side the uptake of sorafenib and sunitinib in vitro by human uptake solute carriers of the SLC22A and SLCO families, the transport by and inhibition of efflux ATP-binding cassette (ABC) transporters, and the role of ABCB1 in the plasma pharmacokinetics and brain penetration of these agents.
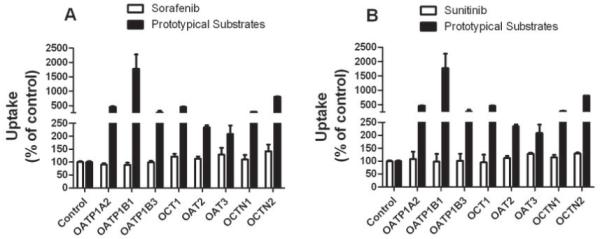
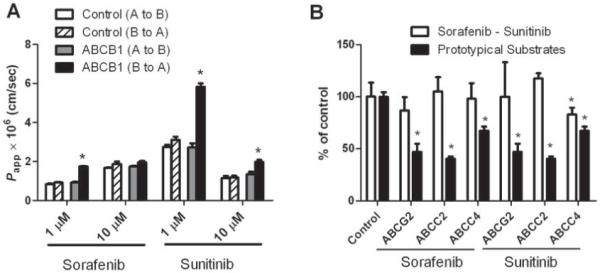
Experimental design: Uptake of [(3)H]sorafenib or [(3)H]sunitinib was assessed in Xenopus laevis oocytes or mammalian cells transfected with cDNAs coding for human OATP1A2, OATP1B1, OATP1B3, OCT1, OAT2, OAT3, OCTN1, or OCTN2. Efflux and inhibition experiments were conducted in cells transfected with human ABCB1, ABCG2, ABCC2, or ABCC4. In vivo pharmacokinetic studies were done in knockout mice lacking Abcb1-type transporters.
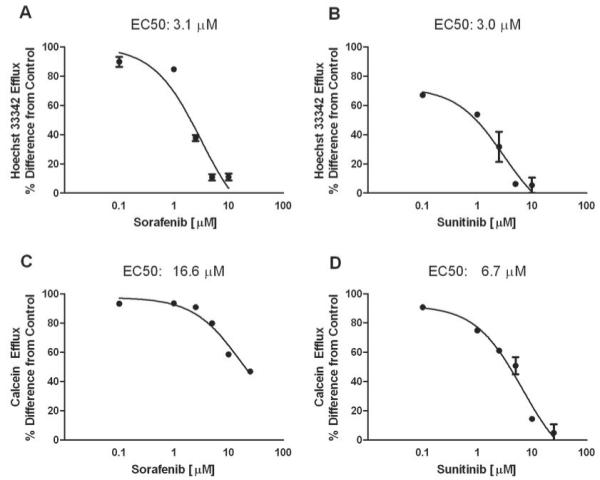
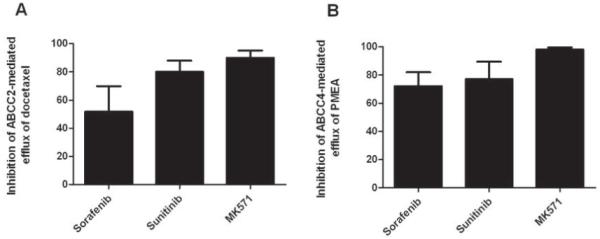
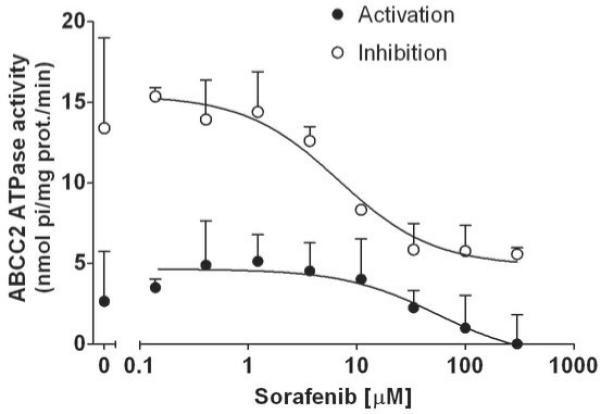
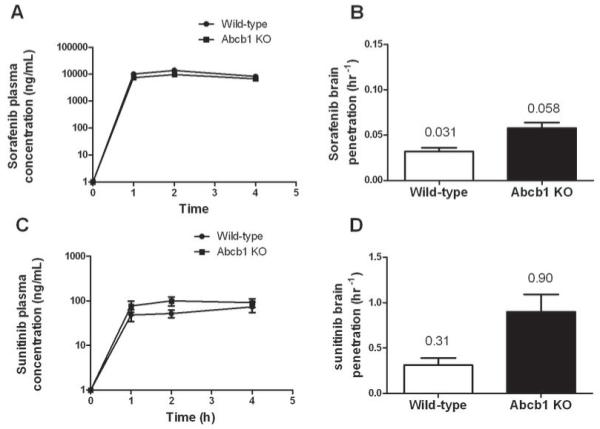
Results: Intracellular uptake was not appreciably affected by any of the studied solute carriers and was minute relative to the respective prototypical substrates. Sorafenib and sunitinib showed concentration-dependent (1 and 10 micromol/L), low to moderate affinity for ABCB1 but were not affected by the other ABC transporters. Both agents inhibited all tested ABC transporters. The absence of Abcb1 had no affect on plasma pharmacokinetics, but brain penetration was moderately increased by 1.9- and 2.9-fold for sorafenib and sunitinib, respectively, in knockout animals versus controls.
Conclusions: Unlike other tyrosine kinase inhibitors, sorafenib and sunitinib do not appear to rely on active transport to enter the cell nor are they high-affinity substrates for ABC efflux transporters. Based on these characteristics, these two drugs may be less susceptible to transporter-mediated alterations in systemic exposure and transporter-related resistance mechanisms.
Figures
Similar articles
-
Double-transduced MDCKII cells to study human P-glycoprotein (ABCB1) and breast cancer resistance protein (ABCG2) interplay in drug transport across the blood-brain barrier.Mol Pharm. 2011 Apr 4;8(2):571-82. doi: 10.1021/mp1003898. Epub 2011 Mar 4. Mol Pharm. 2011. PMID: 21309545
-
Impact of P-glycoprotein (ABCB1) and breast cancer resistance protein (ABCG2) gene dosage on plasma pharmacokinetics and brain accumulation of dasatinib, sorafenib, and sunitinib.J Pharmacol Exp Ther. 2013 Sep;346(3):486-94. doi: 10.1124/jpet.113.205583. Epub 2013 Jul 10. J Pharmacol Exp Ther. 2013. PMID: 23843632
-
Sunitinib (Sutent, SU11248), a small-molecule receptor tyrosine kinase inhibitor, blocks function of the ATP-binding cassette (ABC) transporters P-glycoprotein (ABCB1) and ABCG2.Drug Metab Dispos. 2009 Feb;37(2):359-65. doi: 10.1124/dmd.108.024612. Epub 2008 Oct 29. Drug Metab Dispos. 2009. PMID: 18971320 Free PMC article.
-
Clinical pharmacokinetics of tyrosine kinase inhibitors.Cancer Treat Rev. 2009 Dec;35(8):692-706. doi: 10.1016/j.ctrv.2009.08.004. Epub 2009 Sep 5. Cancer Treat Rev. 2009. PMID: 19733976 Review.
-
Sorafenib and sunitinib.Oncologist. 2009 Aug;14(8):800-5. doi: 10.1634/theoncologist.2009-0088. Epub 2009 Aug 1. Oncologist. 2009. PMID: 19648603 Free PMC article. Review. No abstract available.
Cited by
-
Impact of Selected Small-Molecule Kinase Inhibitors on Lipid Membranes.Pharmaceuticals (Basel). 2021 Jul 29;14(8):746. doi: 10.3390/ph14080746. Pharmaceuticals (Basel). 2021. PMID: 34451842 Free PMC article.
-
Sucralose, a synthetic organochlorine sweetener: overview of biological issues.J Toxicol Environ Health B Crit Rev. 2013;16(7):399-451. doi: 10.1080/10937404.2013.842523. J Toxicol Environ Health B Crit Rev. 2013. PMID: 24219506 Free PMC article. Review.
-
Brain and Testis Accumulation of Regorafenib is Restricted by Breast Cancer Resistance Protein (BCRP/ABCG2) and P-glycoprotein (P-GP/ABCB1).Pharm Res. 2015 Jul;32(7):2205-16. doi: 10.1007/s11095-014-1609-7. Epub 2015 Jan 8. Pharm Res. 2015. PMID: 25563977
-
PharmGKB summary: very important pharmacogene information for SLC22A1.Pharmacogenet Genomics. 2014 Jun;24(6):324-8. doi: 10.1097/FPC.0000000000000048. Pharmacogenet Genomics. 2014. PMID: 24681965 Free PMC article. No abstract available.
-
ABCC4 Is a Determinant of Cytarabine-Induced Cytotoxicity and Myelosuppression.Clin Transl Sci. 2016 Feb;9(1):51-9. doi: 10.1111/cts.12366. Epub 2016 Feb 4. Clin Transl Sci. 2016. PMID: 26842729 Free PMC article.
References
-
- Fabian MA, Biggs WH, 3rd, Treiber DK, et al. A small molecule-kinase interaction map for clinical kinase inhibitors. Nat Biotechnol. 2005;23:329–36. - PubMed
-
- Wilhelm S, Carter C, Lynch M, et al. Discovery and development of sorafenib: a multikinase inhibitor for treating cancer. Nat Rev Drug Discov. 2006;5:835–44. - PubMed
-
- Chow LQ, Eckhardt SG. Sunitinib: from rational design to clinical efficacy. J Clin Oncol. 2007;25:884–96. - PubMed
-
- Zhang W, Konopleva M, Shi YX, et al. Mutant FLT3: a direct target of sorafenib in acute myelogenous leukemia. J Natl Cancer Inst. 2008;100:184–98. - PubMed
Publication types
MeSH terms
Substances
Grants and funding
LinkOut - more resources
Full Text Sources
Molecular Biology Databases
