. 2009 Oct 1;69(19):7867-74.
doi: 10.1158/0008-5472.CAN-09-0800. Epub 2009 Sep 22.

Adipocytes impair leukemia treatment in mice

Affiliations

Adipocytes impair leukemia treatment in mice

James W Behan et al. Cancer Res. .

Abstract

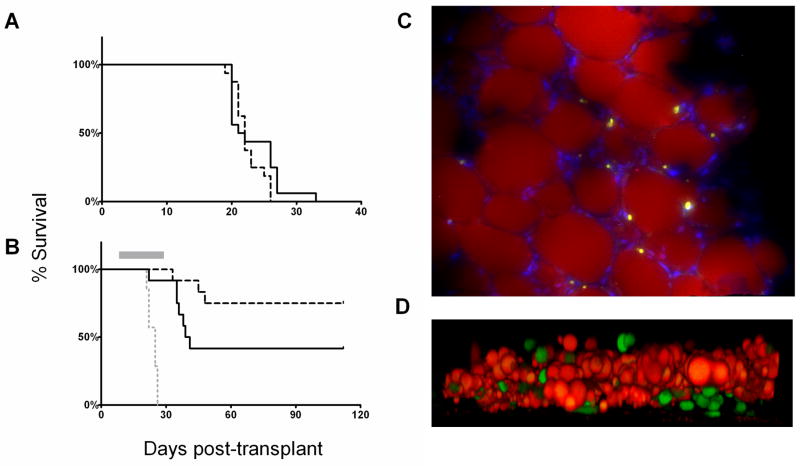
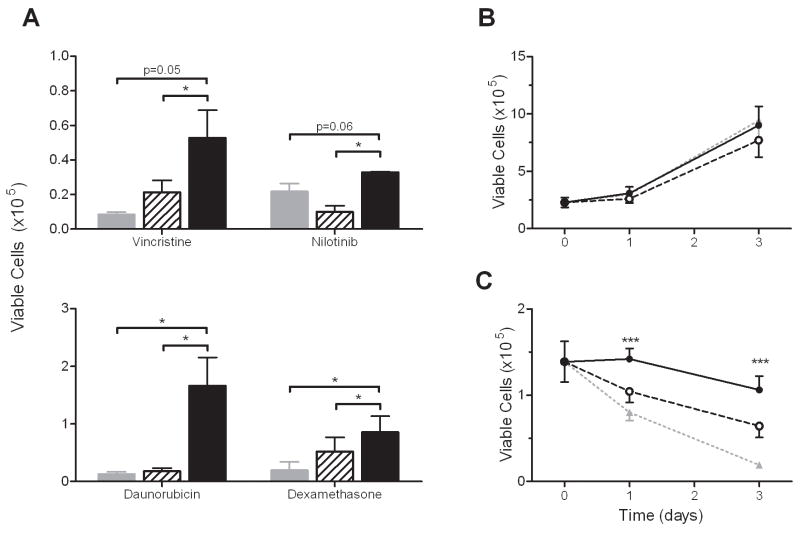
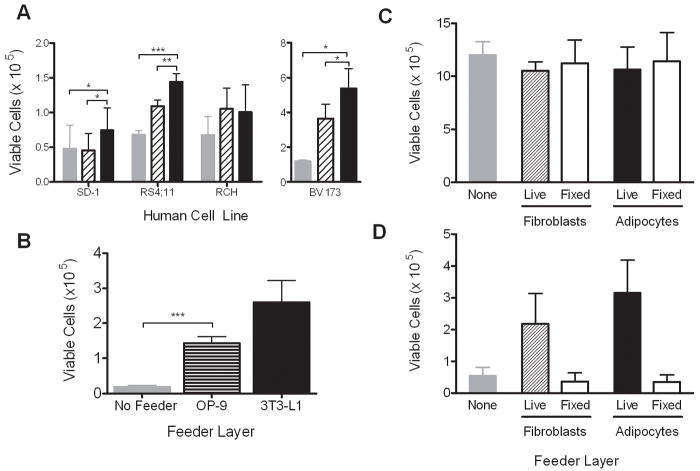
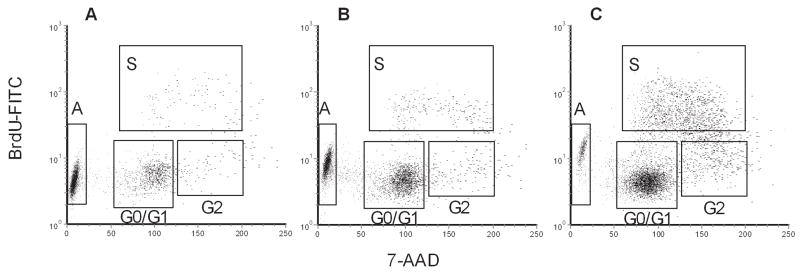
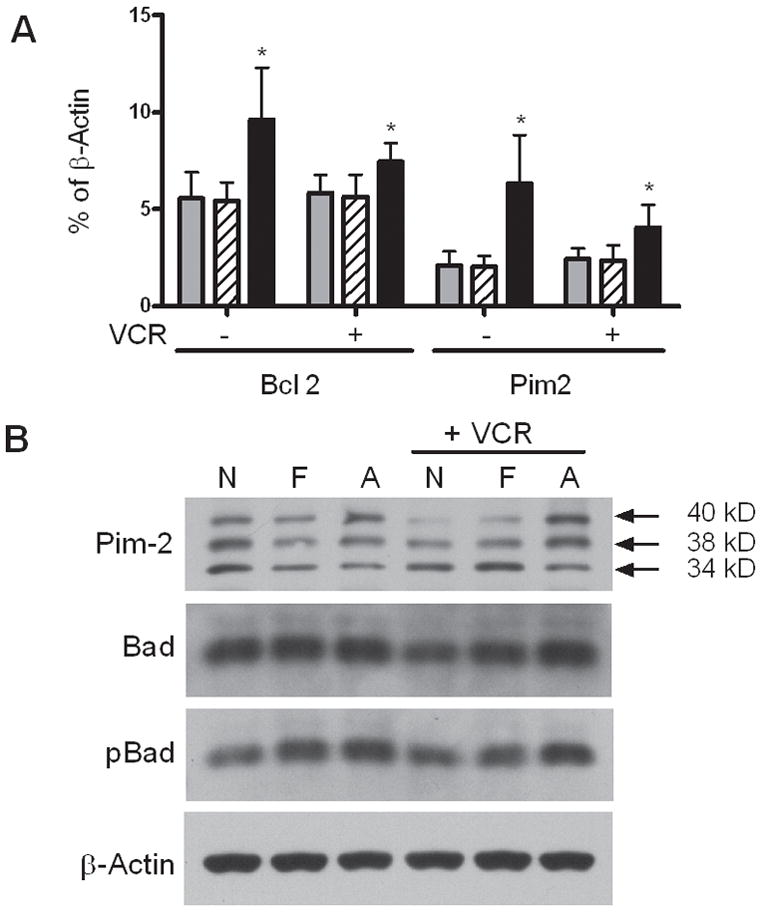
Obesity is associated with increased cancer incidence and mortality. We have previously found that obesity in children is associated with a 50% increased recurrence of acute lymphoblastic leukemia (ALL) in high-risk patients. We have therefore developed novel in vivo and in vitro preclinical models to study the mechanism(s) of this association. Obesity increased relapse after monotherapy with vincristine (P = 0.03) in obese mice injected with syngeneic ALL cells. This occurred although the drug was dosed proportionally to body weight, equalizing blood and tissue drug levels. In coculture, 3T3-L1 adipocytes significantly impaired the antileukemia efficacy of vincristine, as well as three other chemotherapies (P < 0.05). Interestingly, this protection was independent of cell-cell contact, and it extended to human leukemia cell lines as well. Adipocytes prevented chemotherapy-induced apoptosis, and this was associated with increased expression of the two prosurvival signals Bcl-2 and Pim-2. These findings highlight the role of the adipocyte in fostering leukemia chemotherapy resistance, and may help explain the increased leukemia relapse rate in obese children and adults. Given the growing prevalence of obesity worldwide, these effects are likely to have increasing importance to cancer treatment.


Figures

Figure 1
Figure 1
Diet-induced obesity impairs vincristine treatment. A: Obese (solid line) and non-obese (dashed line) mice transplanted with 5,000 syngeneic 8093 leukemia cells and left untreated (p=0.22). B: Mice transplanted with 10,000 8093 cells and treated with 0.5 mg/kg/week vincristine (gray bar). Solid line = obese mice (n=12), dashed black line = control mice (n=12), gray dotted line = vehicle-treated controls (n=7). C: GFP+ 8093 ALL cells in the perirenal fat pad of a transplanted obese mouse which developed progressive leukemia during vincristine treatment. Lipid is stained with Nile Red, and the image is counterstained with Dapi. Image was taken on a Leica DM RXA2 with a 20x objective with 1.6x Optovar magnification (32x final). Picture is representative of fat pads obtained from the other 4 mice after vincristine treatment. D: GFP+ 8093 leukemia cells (green) and adipocyte feeder layer (lipid stained with Nile Red) after 48 hours in co-culture. Images obtained with a Zeiss LSM-510 laser scanning confocal/multiphoton microscope with a 40X objective lens (Carl Zeiss Inc. Thornwood NY). Image represents Z-stack transformation (“side view”) of the adipocyte monolayer and leukemia cells (Volocity 4.3, Improvisation Inc., Waltham, MA).
Figure 2
Figure 2
Co-culture with 3T3-L1 adipocytes provides significant protection against drug treatment to 8093 leukemia cells. A: Number of viable leukemia cells after 72 hours of exposure to vincristine (5 nM), nilotinib (20 nM), daunorubicin (35 nM), or dexamethasone (25 nM) while in co-culture with 3T3-L1 fibroblasts (hatched bars) or adipocytes (solid bars), compared to culture alone (gray bars). B: Proliferation of 8093 cells in TransWells over no feeder (dotted gray line, triangles), fibroblasts (dashed line, open circles), and adipocytes (solid line, closed circles, p=n.s. for all comparisons; n=5 experiments performed in triplicate). C: Viable 8093 cells during exposure to 5 nM vincristine while in TransWells over adipocytes (solid line), fibroblasts (black dashed line), or no feeder layer (gray dotted line; n=5 expts done in triplicate) *p<0.05, ***p<0.005 adipocyte vs. fibroblast feeder layer, paired t-test.
Figure 3
Figure 3
Adipocytes protect other ALL cell lines against vincristine. A: Viable SD-1, RS(4;11), BV173, and RCH ACV cells after 72 hours of exposure to 5 nM vincristine in TransWells over adipocytes (black bars), fibroblasts (hatched bars), or no feeder (gray bars). B: Number of viable 8093 cells after 72 hour exposure to 5 nM vincristine in TransWells over OP9 bone marrow derived adipocytes (striped bar), 3T3-L1 derived adipocytes (black bar), and no feeder (gray bar). One of two representative experiments shown, each done in triplicate. C, D: Number of viable 8093 cells after 72 hours of co-culture in TransWells over PFA fixed or unfixed fibroblasts or adipocytes, without (C) or with (D) 5 nM vincristine (n=3 experiments, each done in triplicate; *p<0.05, **p<0.01, ***p<0.005)
Figure 4
Figure 4
Adipocytes prevent 8093 apoptosis in response to 5 nM vincristine. A–C: Leukemia cells were grown in TransWells for 48 hours over no feeder (A), fibroblasts (B), or adipocytes, (C) with 5 nM vincristine. Top panels show the composite plots from all 3 replicates of BrdU vs. 7-AAD with gating used to define cell cycle phases: A = apoptosis, S = synthesis, G0/G1 = G0/G1 phase, G2 = G2 + M phase.
Figure 5
Figure 5
Effect of adipocytes on leukemia cell expression of the survival genes Pim-2 and bcl-2. A: Gene expression of leukemia cells was quantified by rtPCR after 24 hour exposure to no stroma (gray bars), fibroblasts (hatched bars) or adipocytes (black bars), with or without vincristine. Results are expressed as % of β-actin gene expression. The averages and SD of 5 biological replicates are shown. *p<0.05 vs. both no feeder and fibroblast layers. B: Cropped western blots of 8093 protein lysates showing the 3 murine isoforms of Pim-2, Bad, and phospho-S112 Bad, after exposure to no feeder layer (N), fibroblasts (F), or adipocytes (A), with or without 5 nM vincristine. β-actin is shown as a loading control. 1 of 2 representative experiments is shown. Full length blots are in Supplemental Figure S4.

References

    1. Calle EE, Rodriguez C, Walker-Thurmond K, Thun MJ. Overweight, obesity, and mortality from cancer in a prospectively studied cohort of U.S. adults. N Engl J Med. 2003;348:1625–38. - PubMed
    1. McTiernan A. Obesity and cancer: the risks, science, and potential management strategies. Oncology (Williston Park) 2005;19:871–81. - PubMed
    1. El Serag HB. Obesity and disease of the esophagus and colon. Gastroenterol Clin North Am. 2005;34:63–82. - PubMed
    1. Ross JA, Parker E, Blair CK, Cerhan JR, Folsom AR. Body mass index and risk of leukemia in older women. Cancer Epidemiol Biomarkers Prev. 2004;13:1810–3. - PubMed
    1. Hursting SD, Margolin BH, Switzer BR. Diet and human leukemia: an analysis of international data. Prev Med. 1993;22:409–22. - PubMed

Publication types

MeSH terms

Substances