. 2009 Oct 1;69(19):7557-68.
doi: 10.1158/0008-5472.CAN-09-0270. Epub 2009 Sep 22.

Molecular distinctions between stasis and telomere attrition senescence barriers shown by long-term culture of normal human mammary epithelial cells

Affiliations

Molecular distinctions between stasis and telomere attrition senescence barriers shown by long-term culture of normal human mammary epithelial cells

James C Garbe et al. Cancer Res. .

Abstract

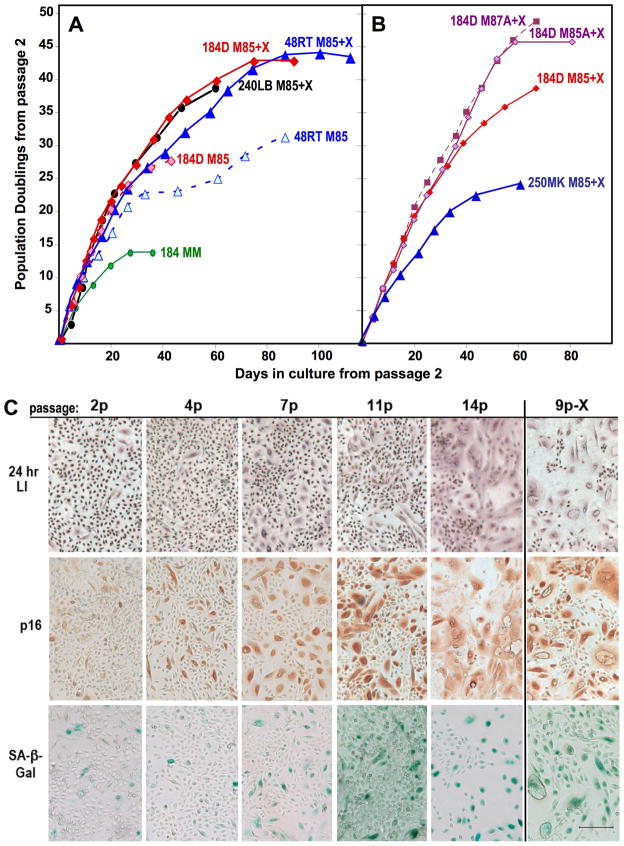
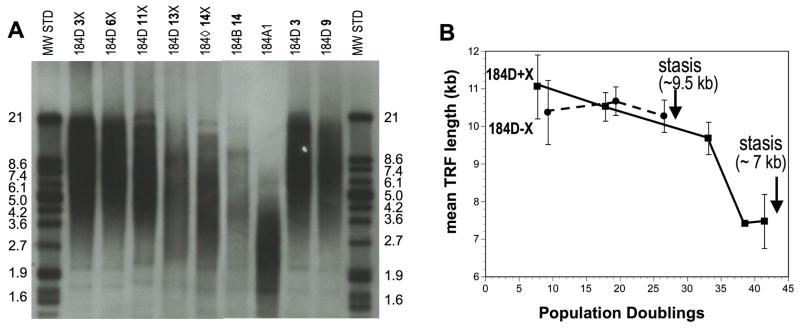
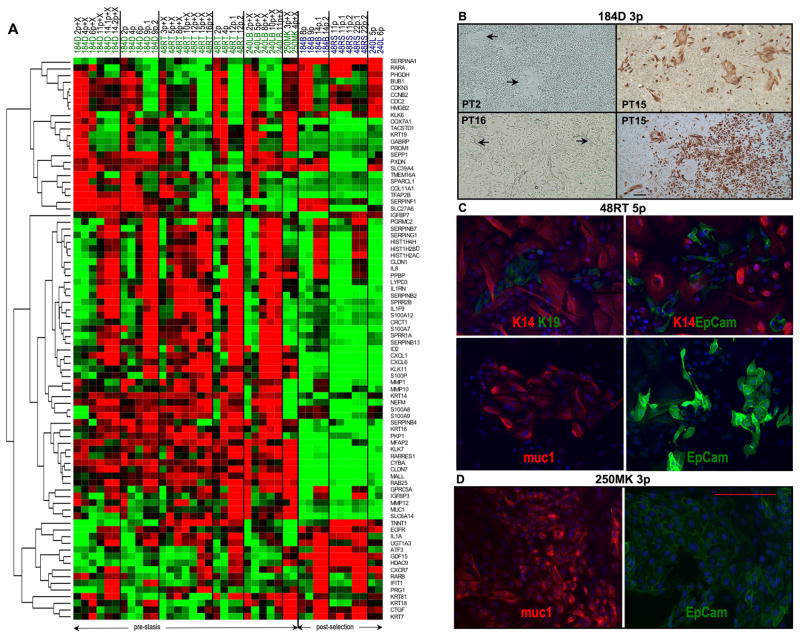
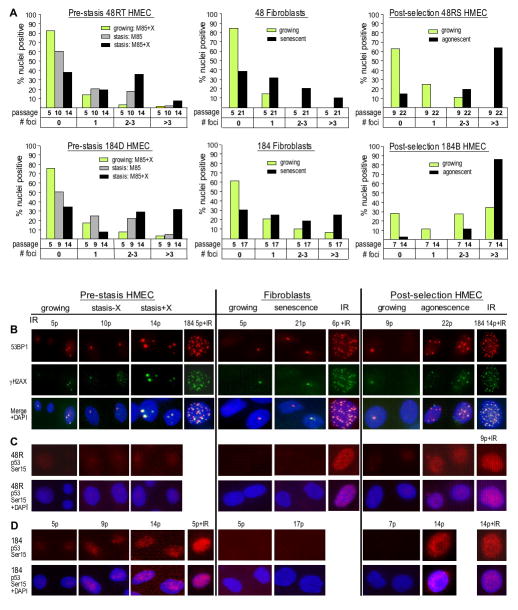
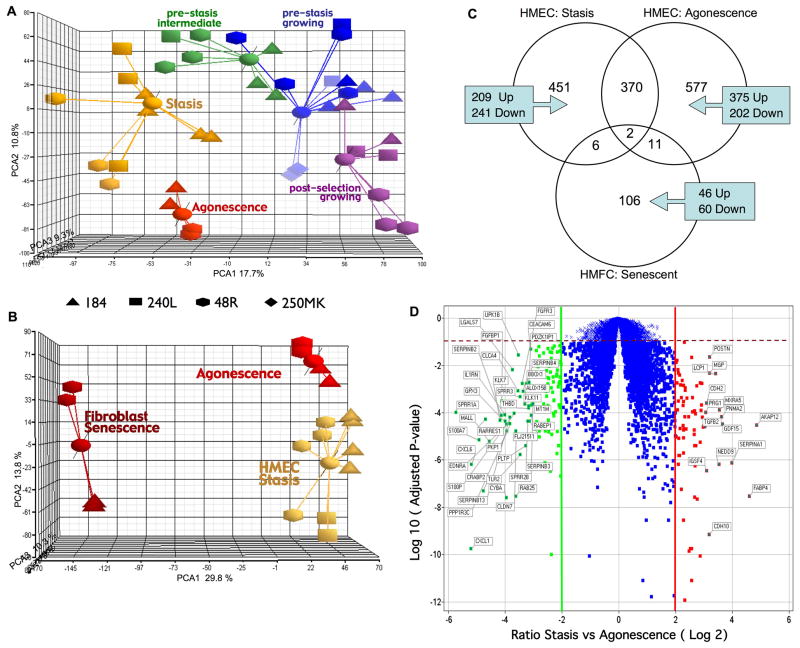
Normal human epithelial cells in culture have generally shown a limited proliferative potential of approximately 10 to 40 population doublings before encountering a stress-associated senescence barrier (stasis) associated with elevated levels of cyclin-dependent kinase inhibitors p16 and/or p21. We now show that simple changes in medium composition can expand the proliferative potential of human mammary epithelial cells (HMEC) initiated as primary cultures to 50 to 60 population doublings followed by p16-positive, senescence-associated beta-galactosidase-positive stasis. We compared the properties of growing and senescent pre-stasis HMEC with growing and senescent post-selection HMEC, that is, cells grown in a serum-free medium that overcame stasis via silencing of p16 expression and that display senescence associated with telomere dysfunction. Cultured pre-stasis populations contained cells expressing markers associated with luminal and myoepithelial HMEC lineages in vivo in contrast to the basal-like phenotype of the post-selection HMEC. Gene transcript and protein expression, DNA damage-associated markers, mean telomere restriction fragment length, and genomic stability differed significantly between HMEC populations at the stasis versus telomere dysfunction senescence barriers. Senescent isogenic fibroblasts showed greater similarity to HMEC at stasis than at telomere dysfunction, although their gene transcript profile was distinct from HMEC at both senescence barriers. These studies support our model of the senescence barriers encountered by cultured HMEC in which the first barrier, stasis, is retinoblastoma-mediated and independent of telomere length, whereas a second barrier (agonescence or crisis) results from telomere attrition leading to telomere dysfunction. Additionally, the ability to maintain long-term growth of genomically stable multilineage pre-stasis HMEC populations can greatly enhance experimentation with normal HMEC.


Figures

Figure 1
Figure 1
Growth of pre-stasis HMEC in M85 or M87 ± oxytocin (X) or BSA (A). A. Primary cultures from three reduction mammoplasty specimens were started from organoids and grown in M85±X. The number of PD in primary culture cannot be accurately determined; growth is shown starting from 2p with cells obtained from PT 2. Each point represents cell counts at successive passage levels, e.g., the final points shown in 1A for 184D 48RT, and 240LB grown in M85+X are respectively 16p, 17p, and 11p. All media contained cholera toxin from passage 2. B. Frozen stocks of second pasasge184D HMEC from PT 3 were grown in media with (M85) or without (M87) CM ± lipid rich BSA (A), in the presence of oxytocin. 250MK are derived from milk, grown in MM for primary culture, then switched to M85+X at second passage. C. Expression of markers associated with proliferation (LI) and senescence (p16, SA-β-Gal) in pre-stasis 184 HMEC with increasing passage. All cells except for 9p-X were grown in M85 with oxytocin; stasis in this population was at 15p. The 9p-X culture was grown in M85 without oxytocin; stasis was at 10p. Cultures examined are from the growth curve shown in Fig. 1A. Note the reciprocal relationship between the small cells with a positive LI, and the larger, often vacuolated cells that are positive for p16 and SA-β-Gal, and negative for LI. Size marker = 200 microns.
Figure 2
Figure 2
Mean TRF length of pre-stasis 184D HMEC with increasing passage. Pre-stasis HMEC are from Fig. 1A. Agonescent post-selection HMEC (184B 14p), and the immortally transformed line 184A1, are shown for comparison; 184A1 has a reported mean TRF length of ~3–5 kb, agonescent 184 HMEC have a reported faint signal with a mean TRF of ≤ 5 kb (15,50). Molecular weight standards are shown on the outside lanes. A. Representative gel; B. Calculated mean TRF values from 3 independent gels (1 sample only at 13p).
Figure 3
Figure 3
Gene transcript and protein expression in pre-stasis HMEC from different individuals. A. Hierarchical clustering (by rows) of gene transcript profiles in growing and senescent pre-stasis and post-selection HMEC. Pre-stasis 184D, 48RT, and 240LB HMEC (from figure 1A) are shown in columns with increasing passage (p) up to stasis; (X) indicates growth in oxytocin. Post-selection 184B and 48RS HMEC are growing and agonescent populations. Genes shown are 77 selected for the greatest variance across all samples, plus a few selected lineage or differentiation-associated genes. B. Morphology and K19 expression in pre-stasis 184D HMEC grown in M85+X at passage 3: A culture from PT 2 shows cobblestone and closed colony (arrows) morphologies, while a culture from PT 16 shows more heterogeneous morphologies, including cells with cytoplasm that extends over other cells (arrows). Cultures from PT 15 stained for K19 by IHC show the presence of K19 protein in cells with the closed colony morphology as well as in some areas with cobblestone and extended morphologies. Size marker = 200 microns. C. Lineage markers in 48RT passage 5 (from PT 5) stained by IF. Cultures show cells displaying luminal markers (K19, EpCam, muc1) interspersed with cells displaying myoepithelial lineage marker (K14) and as small homogeneous patches. D. Lineage markers in 250MK passage 3 illustrate a luminal phenotype. Size marker = 200 microns.
Figure 4
Figure 4
Markers of DNA damage in growing and senescent pre-stasis and post-selection HMEC, and isogenic HMFC. Senescent cultures were examined one passage prior to when cultures showed no net increase in cell number. A. 53BP1 foci; Note the higher level of foci in agonescent HMEC compared to senescent HMFC or HMEC at stasis, and the higher level of foci in cells from specimen 184 compared to specimen 48. B–D. Representative IF images of growing and senescent pre-stasis and post-selection HMEC, and isogenic HMFC. B: 53BP1 and γH2AX foci in specimen 48; C–D: activated p53 in specimens 48 and 184. Cells exposed to 10 Gy of IR are shown as positive controls. Note the greater number of foci, and higher level of serine15-phosphorylated p53 in agonescent HMEC compared to senescent HMFC or HMEC at stasis. Cultures examined are from the growth curve shown in Fig. 1A.
Figure 5
Figure 5
Relationship of growing and senescent HMEC and HMFC as determined by transcriptional profiles. A. PCA plot of transcriptional profiles of growing and senescent pre-stasis and post-selection HMEC. B. PCA plot of transcriptional profiles of all senescent HMEC and HMFC. The 3D scatter plots show the first three principal components of the analysis of 9702 genes. Data points from different individuals are represented by different shapes. C. Venn diagram of genes modulated at HMEC stasis using growing pre stasis as baseline, at HMEC agonescence using growing post selection as baseline, or at HMFC senescence with growing fibroblast as baseline. Diagram depicts the number of genes unique to each group and the number that overlap between and among the groups. D. Volcano plot illustrating genes significantly differentially expressed between stasis vs. agonescence. The x- axis represents the fold change ratio (log2) between HMEC at stasis and agonescence. The y-axis represents the significance with adjusted p-values. The graph is segmented to represent the genes that satisfy the fold change criteria of +/− 2 and adjusted p <0.1. Segments on right and left show the genes up-regulated at agonescence (79) and stasis (116) respectively. Genes with more then eight fold change difference between stasis and agonescence are labeled.

References

    1. Stampfer MR. Cholera toxin stimulation of human mammary epithelial cells in culture. In Vitro. 1982;18:531–7. - PubMed
    1. Hammond SL, Ham RG, Stampfer MR. Serum-free growth of human mammary epithelial cells: Rapid clonal growth in defined medium and extended serial passage with pituitary extract. Proc Natl Acad Sci U S A. 1984;81:5435–9. - PMC - PubMed
    1. Ramirez RD, Morales CP, Herbert BS, et al. Putative telomere-independent mechanisms of replicative aging reflect inadequate growth conditions. Genes Dev. 2001;15:398–03. - PMC - PubMed
    1. Rheinwald JG, Hahn WC, Ramsey MR, et al. A two-stage, p16INK4a-and p53-dependent keratinocyte senescence mechanism that limits replicative potential independent of telomere status. Mol Cell Biol. 2002;22:5157–72. - PMC - PubMed
    1. Romanov S, Kozakiewicz K, Holst C, Stampfer MR, Haupt LM, Tlsty T. Normal human mammary epithelial cells spontaneously escape senescence and acquire genomic changes. Nature. 2001;409:633–7. - PubMed

Publication types

MeSH terms