. 2010 Jan;30(1):196-210.
doi: 10.1038/jcbfm.2009.195. Epub 2009 Sep 23.

Kinetic modeling of the serotonin 5-HT(1B) receptor radioligand [(11)C]P943 in humans

Affiliations

Kinetic modeling of the serotonin 5-HT(1B) receptor radioligand [(11)C]P943 in humans

Jean-Dominique Gallezot et al. J Cereb Blood Flow Metab. 2010 Jan.

Abstract

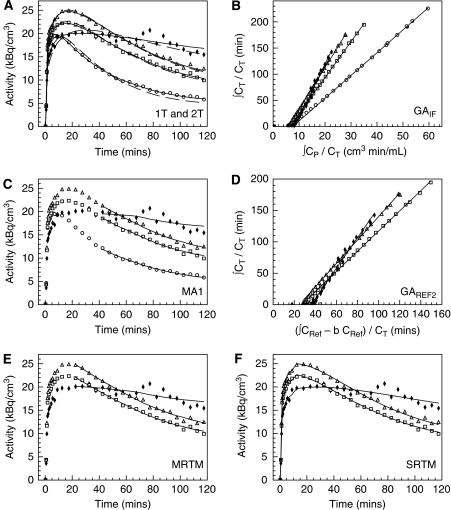
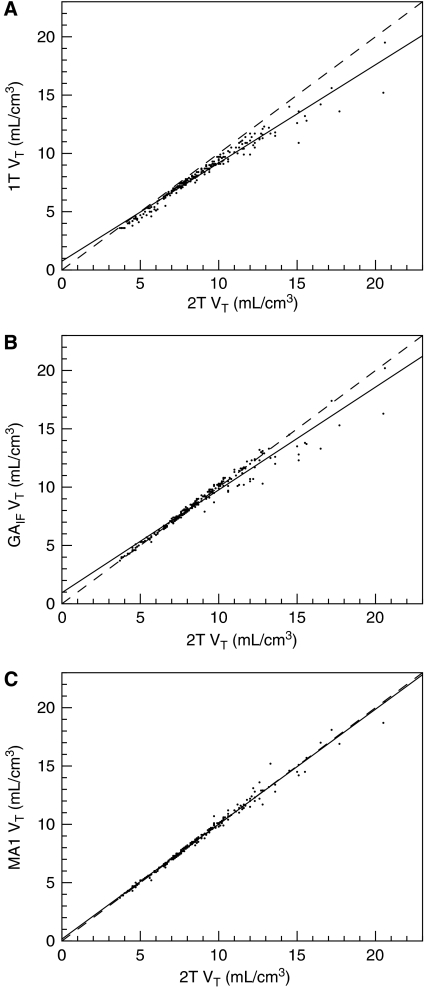
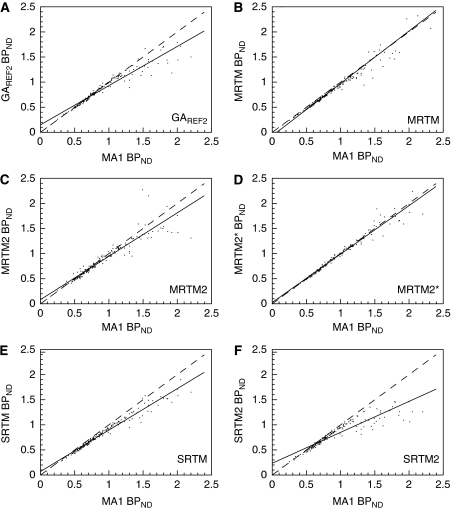
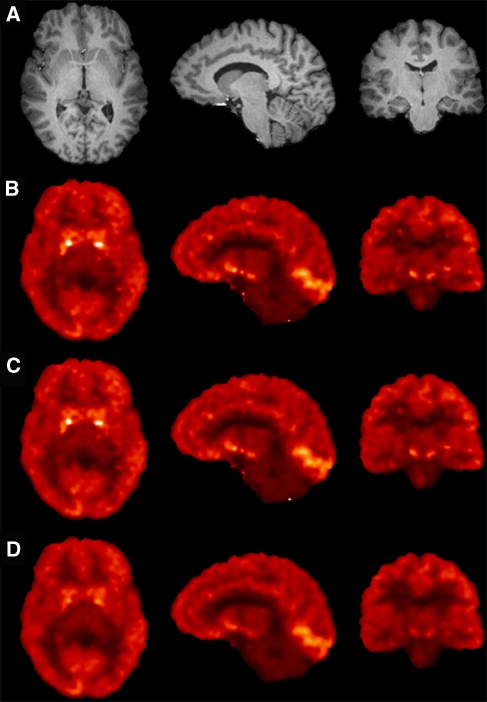
[(11)C]P943 is a new radioligand recently developed to image and quantify serotonin 5-Hydroxytryptamine (5-HT(1B)) receptors with positron emission tomography (PET). The purpose of this study was to evaluate [(11)C]P943 for this application in humans, and to determine the most suitable quantification method. Positron emission tomography data and arterial input function measurements were acquired in a cohort of 32 human subjects. Using arterial input functions, compartmental modeling, the Logan graphical analysis, and the multilinear method MA1 were tested. Both the two tissue-compartment model and MA1 provided good fits of the PET data and reliable distribution volume estimates. Using the cerebellum as a reference region, BP(ND) binding potential estimates were computed. [(11)C]P943 BP(ND) estimates were significantly correlated with in vitro measurements of the density of 5-HT(1B) receptors, with highest values in the occipital cortex and pallidum. To evaluate noninvasive methods, two- and three-parameter graphical analyses, Simplified Reference Tissue Models (SRTM and SRTM2), and Multilinear Reference Tissue Models (MRTM and MRTM2) were tested. The MRTM2 model provided the best correlation with MA1 binding-potential estimates. Parametric images of the volume of distribution or binding potential of [(11)C]P943 could be computed using both MA1 and MRTM2. The results show that [(11)C]P943 provides quantitative measurements of 5-HT(1B) binding potential.


Figures

Figure 1
Figure 1
Time–activity curves, Logan plots, and fits obtained in selected ROIs: cerebellum (circles), parietal (squares), calcarine cortex (triangles), and pallidum (solid diamonds). (A) Fits obtained with the one-tissue (1T) compartment model (dashed line) or the two-tissue (2T) compartment model (solid line). (B) Graphical analysis with input function (GAIF). (C) Fits obtained with the multilinear analysis using the input function (MA1). (D) Graphical analysis using reference region data GAREF2. (E) Fits obtained with multilinear analyses using reference region data (MRTM). (F) Fits obtained with the simplified reference tissue model (SRTM). t* was set to 40 mins for panels B and C, and to 10 and 20 mins for panels D and E, respectively. 313 × 352 mm2 (600 × 600 d.p.i.).
Figure 2
Figure 2
Selected correlations between VT estimated with analyses using input function data. Solid line represents the line of best fit. Dashed line is the line of identity. (A) 1T versus 2T (B) GAIF versus 2T (C) MA1 versus 2T. See Table 2 for regression values. 156 × 352 mm2 (600 × 600 d.p.i.).
Figure 3
Figure 3
Selected correlations between BPND estimated with methods using the cerebellum as a reference region and MA1. Solid line is the line of best fit. Dashed line is the line of identity. (A) GAREF2 versus MA1. t* is 10 mins for GAREF2 and 40 mins for MA1. (B) MRTM versus MA1. t* is 20 mins for MRTM and 40 mins for MA1 (C) MRTM2, with b′ coupled across regions for each subject, versus MA1. t* is 30 mins for MRTM2 and 40 mins for MA1. (D) MRTM2*, with b′ fixed at −37 mins, versus MA1. t* is 40 mins for both methods. (E) SRTM versus MA1. (F) SRTM2, with k2 coupled across region for each subject, versus MA1. See Table 2 for regression values. 313 × 352 mm2 (600 × 600 d.p.i.).
Figure 4
Figure 4
MR anatomic image (row A) and parametric images of VT obtained on the same healthy control subject with MA1 (row B), and BPND obtained with MRTM2 (row C) and SRTM2 (row D), in axial, sagittal, and coronal views (from left to right). The slices were selected to display high binding regions: pallidum (axial view), occipital (sagittal view), and substantia nigra (coronal view). The VT color scale ranges form 0 to 17.3 mL/cm3, and the BPND color scale ranges from −1 (to maximize the visual identity between VT and BPND images) to 3. Differences between the SRTM2 images and the MA1 or MRTM2 images are especially visible in the small receptor-rich regions, where SRTM2 BPND values are underestimated. 79 × 106 mm2 (300 × 300 d.p.i.).
Figure 5
Figure 5
Correlations between BPF (Bavail/Kd) estimates from [11C]P943 regional TAC fits with MA1 (t*=40 mins) and the 5-HT1B Bmax measurements using in vitro autoradiography and [3H]GR 125743 reported by Varnäs et al (2001) (A) and Varnäs et al (2004) (B). Region labels are defined as: GP, pallidum; SN, substantia nigra; RN, raphe nucleus; PN, pulvinar nucleus; DN, dorsomedial nucleus; CN, caudate nucleus; PU, putamen; AAC, anterior cingulate cortex; PCC, posterior cingulate cortex; CC, calcarine cortex; FC, frontal cortex; IC, insular cortex; TC, temporal cortex. For cortical regions, the labels are grouped and displayed in the order of the points following the y axis (Bmax) values. In subfigure B, for the cortical regions, the in vitro Bmax values were computed as the unweighted average across cortical layers. For the pallidum, the in vitro Bmax values were computed as the unweighted average of the (internal and external) globus pallidus and ventral pallidum values. The regression line equations are BPF=0.36 Bmax−3, r2=0.671, n=10, P<0.05 (panel A) and BPF=0.23 Bmax+0.2, r2=0.576, n=13, P<0.001 (panel B). The slope of each regression line is an estimate of the in vivo Kd value, and these values are in good agreement with the reported in vitro Ki value (0.77 nmol/L; McCarthy et a, (2007); 1.2 nmol/L; NIMH Psychoactive Drug Screening Program). 355 × 133 mm2 (600 × 600 d.p.i.).

References

    1. Arulmozhi DK, Veeranjaneyulu A, Bodhankar SL. Migraine: current concepts and emerging therapies. Vascul Pharmacol. 2005;43:176–187. - PubMed
    1. Baker KG, Halliday GM, Törk I. Cytoarchitecture of the human dorsal raphe nucleus. J Comp Neurol. 1990;301:147–161. - PubMed
    1. Beck JV, Arnold KJ. Parameter Estimation in Engineering and Science. New York, NY: Wiley; 1977.
    1. Bevington PR, Robinson DK. Data Reduction and Error Analysis for the Physical Sciences. New York, NY: McGraw-Hill; 2003.
    1. Boschert U, Amara DA, Segu L, Hen R. The mouse 5-hydroxytryptamine1b receptor is localized predominantly on axon terminals. Neuroscience. 1994;58:167–182. - PubMed

Publication types

MeSH terms

Substances

LinkOut - more resources