

Assessing exposure metrics for PM and birth weight models
- PMID: 19773814
- PMCID: PMC2889210
- DOI: 10.1038/jes.2009.52
Assessing exposure metrics for PM and birth weight models
Abstract
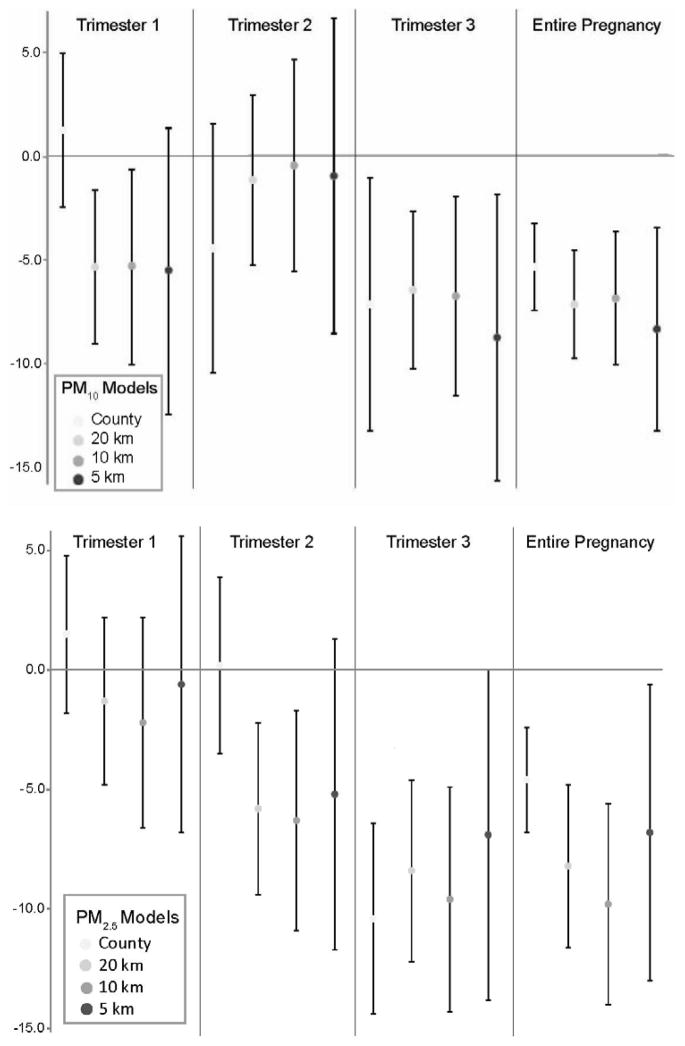
The link between air pollution exposure and adverse birth outcomes is of public health concern due to the relationship between poor pregnancy outcomes and the onset of childhood and adult diseases. As personal exposure measurements are difficult and expensive to obtain, proximate measures of air pollution exposure are traditionally used. We explored how different air pollution exposure metrics affect birth weight regression models. We examined the effect of maternal exposure to ambient levels of particulate matter <10, <2.5 mum in aerodynamic diameter (PM(10), PM(2.5)) on birth weight among infants in North Carolina. We linked maternal residence to the closest monitor during pregnancy for 2000-2002 (n=350,754). County-level averages of air pollution concentrations were estimated for the entire pregnancy and each trimester. For a finer spatially resolved metric, we calculated exposure averages for women living within 20, 10, and 5 km of a monitor. Multiple linear regression was used to determine the association between exposure and birth weight, adjusting for standard covariates. In the county-level model, an interquartile increase in PM(10) and PM(2.5) during the entire gestational period reduced the birth weight by 5.3 g (95% CI: 3.3-7.4) and 4.6 g (95% CI: 2.3-6.8), respectively. This model also showed a reduction in birth weight for PM(10) (7.1 g, 95% CI: 1.0-13.2) and PM(2.5) (10.4 g, 95% CI: 6.4-14.4) during the third trimester. Proximity models for 20, 10, and 5 km distances showed results similar to the county-level models. County-level models assume that exposure is spatially homogeneous over a larger surface area than proximity models. Sensitivity analysis showed that at varying spatial resolutions, there is still a stable and negative association between air pollution and birth weight, despite North Carolina's consistent attainment of federal air quality standards.
Figures


References
-
- Chen L, Yang W, Jennison BL, Goodrich A, Omaye ST. Air Pollution and Birth Weight in Northern Nevada, 1991–1999. Inhal Toxicol. 2002;14:141–157. - PubMed
-
- Ha E-H, Hong Y-C, Lee B-E, Woo B-H, Schwartz J, Christiani DC. Is Air Pollution a Risk Factor for Low Birth Weight in Seoul? Epidemiology. 2001;12(6):643–648. - PubMed
Publication types
MeSH terms
Substances
Grants and funding
LinkOut - more resources
Full Text Sources
Medical
Research Materials
