

Identification of an unusual pattern of global gene expression in group B Streptococcus grown in human blood
- PMID: 19774088
- PMCID: PMC2745576
- DOI: 10.1371/journal.pone.0007145
Identification of an unusual pattern of global gene expression in group B Streptococcus grown in human blood
Abstract
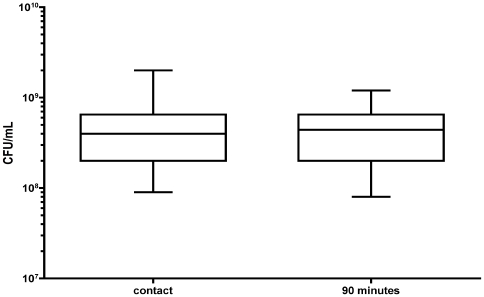
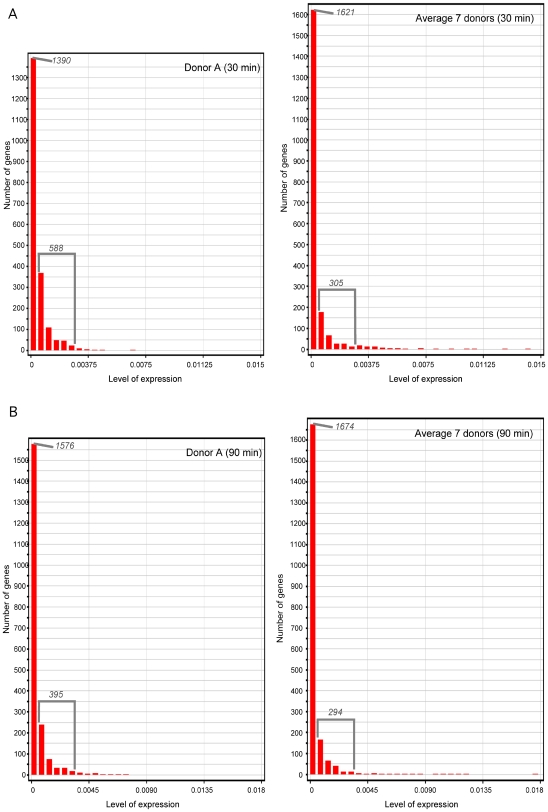
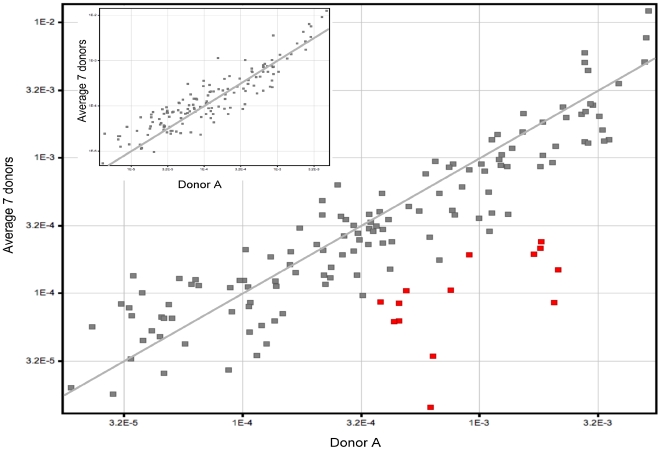
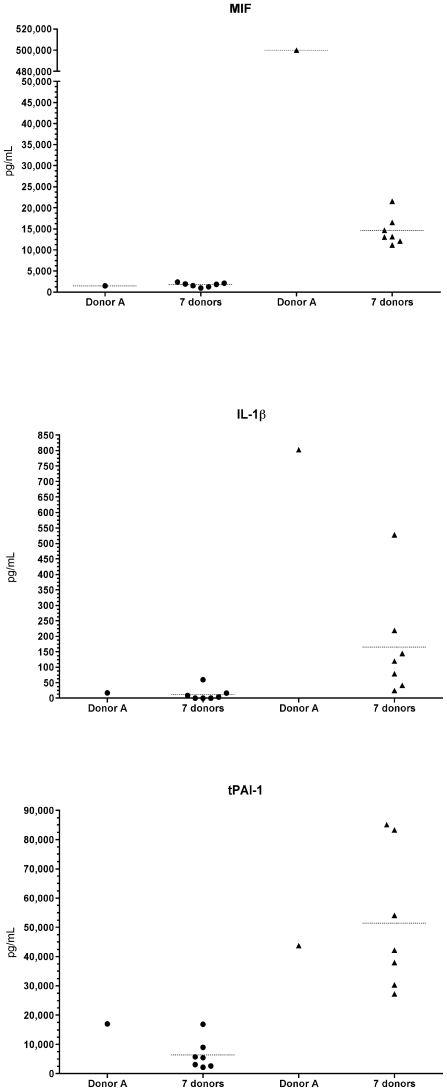
Because passage of the bacterium to blood is a crucial step in the pathogenesis of many group B Streptococcus (GBS) invasive infections, we recently conducted a whole-genome transcriptome analysis during GBS incubation ex vivo with human blood. In the current work, we sought to analyze in detail the difference in GBS gene expression that occurred in one blood sample (donor A) relative to other blood samples. We incubated GBS strain NEM316 with fresh heparinized human blood obtained from healthy volunteers, and analyzed GBS genome expression and cytokine production. Principal component analysis identified extensive clustering of the transcriptome data among all samples at time 0. In striking contrast, the whole bacterial gene expression in the donor A blood sample was significantly different from the gene expression in all other blood samples studied, both after 30 and 90 min of incubation. More genes were up-regulated in donor A blood relative to the other samples, at 30 min and 90 min. Furthermore, there was significant variation in transcript levels between donor A blood and other blood samples. Notably, genes with the highest transcript levels in donor A blood were those involved in carbohydrate metabolism. We also discovered an unusual production of proinflammatory and immunomodulatory cytokines: MIF, tPAI-1 and IL-1beta were produced at higher levels in donor A blood relative to the other blood samples, whereas GM-CSF, TNF-alpha, IFN-gamma, IL-7 and IL-10 remained at lower levels in donor A blood. Potential reasons for our observations are that the immune response of donor A significantly influenced the bacterial transcriptome, or both GBS gene expression and immune response were influenced by the metabolic status of donor A.
Conflict of interest statement
Figures
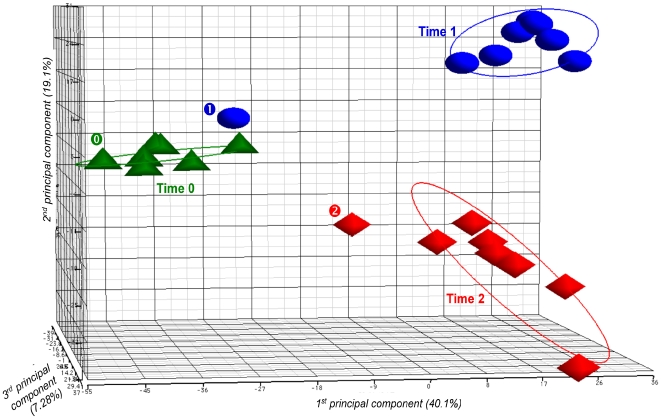
 ” for time 0, “
 ” for time 1, and “
 ” for time 2).
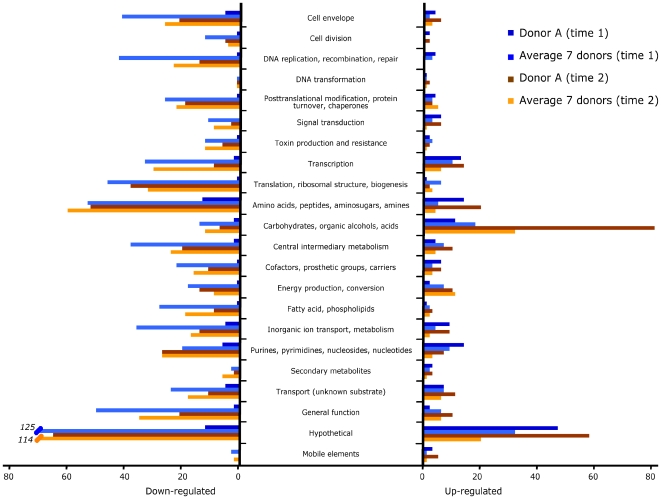
Similar articles
-
Extensive adaptive changes occur in the transcriptome of Streptococcus agalactiae (group B streptococcus) in response to incubation with human blood.PLoS One. 2008 Sep 4;3(9):e3143. doi: 10.1371/journal.pone.0003143. PLoS One. 2008. PMID: 18769548 Free PMC article.
-
Transcriptome adaptation of group B Streptococcus to growth in human amniotic fluid.PLoS One. 2009 Jul 1;4(7):e6114. doi: 10.1371/journal.pone.0006114. PLoS One. 2009. PMID: 19568429 Free PMC article.
-
Global transcriptional profiling reveals Streptococcus agalactiae genes controlled by the MtaR transcription factor.BMC Genomics. 2008 Dec 16;9:607. doi: 10.1186/1471-2164-9-607. BMC Genomics. 2008. PMID: 19087320 Free PMC article.
-
Remodeling of the Streptococcus agalactiae transcriptome in response to growth temperature.PLoS One. 2008 Jul 30;3(7):e2785. doi: 10.1371/journal.pone.0002785. PLoS One. 2008. PMID: 18665215 Free PMC article.
-
Selection of reference genes for real-time expression studies in Streptococcus agalactiae.J Microbiol Methods. 2012 Sep;90(3):220-7. doi: 10.1016/j.mimet.2012.05.011. Epub 2012 May 23. J Microbiol Methods. 2012. PMID: 22634000
Cited by
-
Identification of Glyoxalase A in Group B Streptococcus and its contribution to methylglyoxal tolerance and virulence.bioRxiv [Preprint]. 2024 Dec 19:2024.07.30.605887. doi: 10.1101/2024.07.30.605887. bioRxiv. 2024. Update in: Infect Immun. 2025 Apr 08;93(4):e0054024. doi: 10.1128/iai.00540-24. PMID: 39131367 Free PMC article. Updated. Preprint.
-
Identification of glyoxalase A in group B Streptococcus and its contribution to methylglyoxal tolerance and virulence.Infect Immun. 2025 Apr 8;93(4):e0054024. doi: 10.1128/iai.00540-24. Epub 2025 Feb 26. Infect Immun. 2025. PMID: 40008888 Free PMC article.
-
Transcriptomic and genomic evidence for Streptococcus agalactiae adaptation to the bovine environment.BMC Genomics. 2013 Dec 27;14:920. doi: 10.1186/1471-2164-14-920. BMC Genomics. 2013. PMID: 24369756 Free PMC article.
-
Adaptive response of Group B streptococcus to high glucose conditions: new insights on the CovRS regulation network.PLoS One. 2013 Apr 9;8(4):e61294. doi: 10.1371/journal.pone.0061294. Print 2013. PLoS One. 2013. PMID: 23585887 Free PMC article.
References
-
- Phares CR, Lynfield R, Farley MM, Mohle-Boetani J, Harrison LH, et al. Epidemiology of invasive group B streptococcal disease in the United States, 1999-2005. Jama. 2008;299:2056–2065. - PubMed
-
- Bohnsack JF, Takahashi S, Detrick SR, Pelinka LR, Hammitt LL, et al. Phylogenetic classification of serotype III group B streptococci on the basis of hylB gene analysis and DNA sequences specific to restriction digest pattern type III-3. J Infect Dis. 2001;183:1694–1697. - PubMed
MeSH terms
Substances
LinkOut - more resources
Full Text Sources
Medical
Molecular Biology Databases
Miscellaneous
